Analyse assignments
This page explains how you can analyse the quality of Questions and Assignments in Ans. This analysis uses the scores per Question and can be used to objectively check if Questions need to be removed from the Assignment, before publishing the results. If you are ready to share the results with your students you can check this page how to publish results .
Analysis of Questions and whole Assignments improve overall assessment quality over time. This page will explain several Characteristics, Metrics and Mark statistics of an Assignment, followed by insights into the quality of individual Questions. Finally, an explanation follows how to adjust the contribution of Questions in calculating the score to pass and the final grade of the Assignment.
Insights Overview
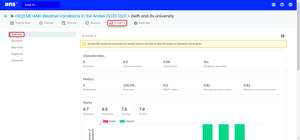
You can find an analysis of the Assignment Results on the Insights tab.
- Go to your Course.
- Go to your Assignment.
- Click the Insights tab.
- Click the Overview submenu.
-
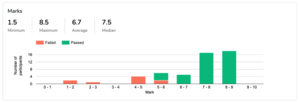
Some information from the Insights Overview is further explained in the table below. You can also see the Characteristics and Metrics in the screenshot above and the Marks in the screenshot below:
Statistic
Explanation
Settings
Characteristics
Guess Score
The score a Learner would theoretically get if they guessed all the answers.
You can take the Guess Score into account by turning on the Guess Correction or using it to Limit The Lowest Mark in the in the Mark Calculations submenu in the Assignment Settings.
Randomly Generated
Flow was applied
Metrics
KR20 / Alpha value
The reliability of the Assignment on a scale from zero to one.
Pass Rate
The percentage of Learners that received a mark above the Pass Mark.
You can see/edit the Pass Mark in the Mark Calculations submenu in the Assignment Settings
Marks
Basic statistics (Minimum, Maximum, Average, Median)
Based on the points scored and the Mark Calculation.
You can see/edit the Mark Calculation in its submenu in the Assignment Settings.
Bar Graph
Most Metrics and Characteristics are unreliable with a small amount of Learners/data. You can trust their accuracy better when at least hundred Learners have participated in multiple Questions.
-
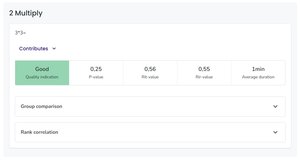
In the Question Insights submenu, you can find statistics regarding the quality of individual Questions. Below, we will explain each of these statistics and how to find them.
- Go to your Course.
- Go to your Assignment.
- Click the Insights tab.
- Click the Questions submenu.
-
The Quality Indication gives an impression of the quality of individual Questions and is summarised in the table. It is based on the P, Rit and Rir-value, which will be explained below.
Indication
Explanation
Value
Easy
Too many Learners answer this Question correctly.
P-value is above 0.9.
Difficult
Too many learners answer this question incorrectly.
P-value is below 0.1.
Needs Attention
This question might be confusing.
Rit-value is below 0.2.
Good
All values are within the appropriate ranges.
Henshall, B. (2023, June). Question insights: Quality indication. Ans Support. Retrieved September 1, 2023, from https://support.ans.app/hc/en-us/articles/360027234814-Questions-insights
-
- The P-value expresses the difficulty of a Question on a scale from zero to one. The P-value is calculated with the following formula:
- P = ([total score of the Participants] / [total number of Participants]) / [total Points for the Question]
- The perfect P-value can differ. For a summative exam you might want Questions with a P-value around 0,6, but in a formative practice test you might be satisfied with a lower P-value.
-
‘Rit’ is an abbreviation of ‘Relation Item Test’ and calculates the correlation between a Questions score and the score on all the Questions in the Assignment, using the Pearsons correlation coefficient. The Rir-value is quite similar but calculates the correlation between a Questions score and the score on all other Questions (excluding this Question) in the Assignment, also using the Pearsons correlation coefficient. Please see the table below for an interpretation of the Rit and Rir values.
Rit-/ Rir-value Indication
Explanation
> 0,40
Very good
Learners with a good overall result also tend to answer this Question well.
0,30 - 0,39
Good
The Question has some room for improvement.
0,20 - 0,29
Mediocre
< 0,19
Reviewing this Question should be considered
Learners with a good overall result perform badly or even worse on this Question than Learners with an overall weak result.
Henshall, B. (2023, June). Question insights: Rit-value [edited]. Ans Support. Retrieved September 1, 2023, from support.ans.app/hc/en-us/articles/360027234814-Questions-insights
-
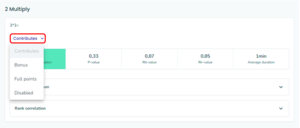
Based on the statistics in the Question Insights, you can decide to change the Contribution of a Question in relation to the final Mark on the Assignment. There are four options for Question Contribution in the Contributes dropdown.
Contribution
Explanation
Contributes
This is the default setting. The Question contributes to the final grade of every Learner.
Bonus
The Question will not be used to calculate the maximum score of the Assignment, but will be added as a bonus for Learners who answered it correctly.
Full Points
Every Learner will be awarded the full number of Points for the Question, regardless of their answer.
Disabled
The Question will be omitted from the Assignment. The Points will not be used to calculate the maximum score of the Assignment or the Learners final grade.
To change the contribution of a Question in an Assignment:
- Go to your Course.
- Go to your Assignment.
- Click the Insights tab.
- Click the Questions submenu.
- Choose an option from the Contributes dropdown.
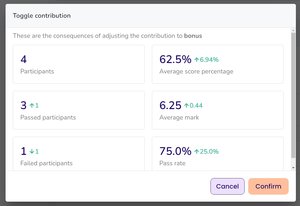
- Ans shows the consequences of changing the Question Contribution in the Toggle Contribution pop-up.
- Click Confirm.
