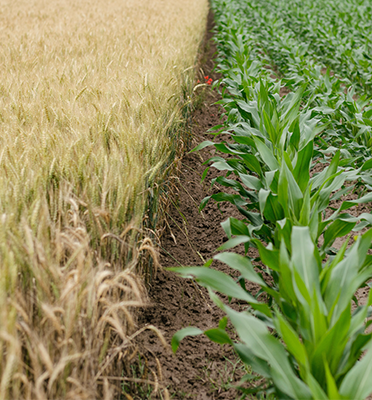
One of the activities taking place at the faculty of Civil Engineering and Geosciences’s department of Geoscience and Remote Sensing is earth observation, or the study of phenomena on earth using images from space. This can be done on large areas and in great detail at the same time. The technique is not just used for making GPS navigation maps and weather forecasts. Satellite photos can also chart the different types of land cover in a country, such as woodland, water and agricultural farmland. The images are so sharp that it is actually possible to zoom in on a field and recognise the type of crop grown on it. But would it be possible to see where the biggest plants are? According to doctoral candidate Ramses Molijn this presented quite a challenge. ‘Zooming in on crops to estimate differences in biomass was not something our department had done before,’ he says.
In 2013 TU Delft and the University of Campinas in Brazil initiated a number of joint PhD programmes backed by the Be-Basic consortium, a Delft-based public private partnership aimed at research into the biobased economy. Molijn’s central research question was whether large-scale monitoring of changes in land cover and crop productivity was feasible. Information about crop productivity can be used to improve yields while analyses of the changes in land cover may provide the consortium with enough data to answer the related research question: ‘What are the consequences of the growing production of energy crops, such as sugarcane in Brazil?’
Bioenergy is big business in Brazil where 40% of cars run on biofuel made from sugarcane. The use of this renewable energy source boosts the local economy and reduces CO2 emissions. That is why, over the past decades, there has been a rapid increase in sugarcane cultivation in the state of São Paulo.
From space
Satellites are used to gather the necessary Remote Sensing images. Molijn uses two instruments to create a reliable dataset: an optical sensor which makes its measurements based on light rays from the Sun and a radar system based on radio waves transmitted from the satellite. The optical images are very detailed, with one pixel representing an area of up to 2 square metres. Unfortunately, the optical sensor is incapable of seeing through clouds. Because Brazil has rainy seasons Molijn also uses radar images which do not depend on climatological circumstances. Molijn developed a model to combine and analyse the images with Postdoc Lorenzo Iannini. The different types of land cover need to be observed and categorised correctly.
Fieldwork
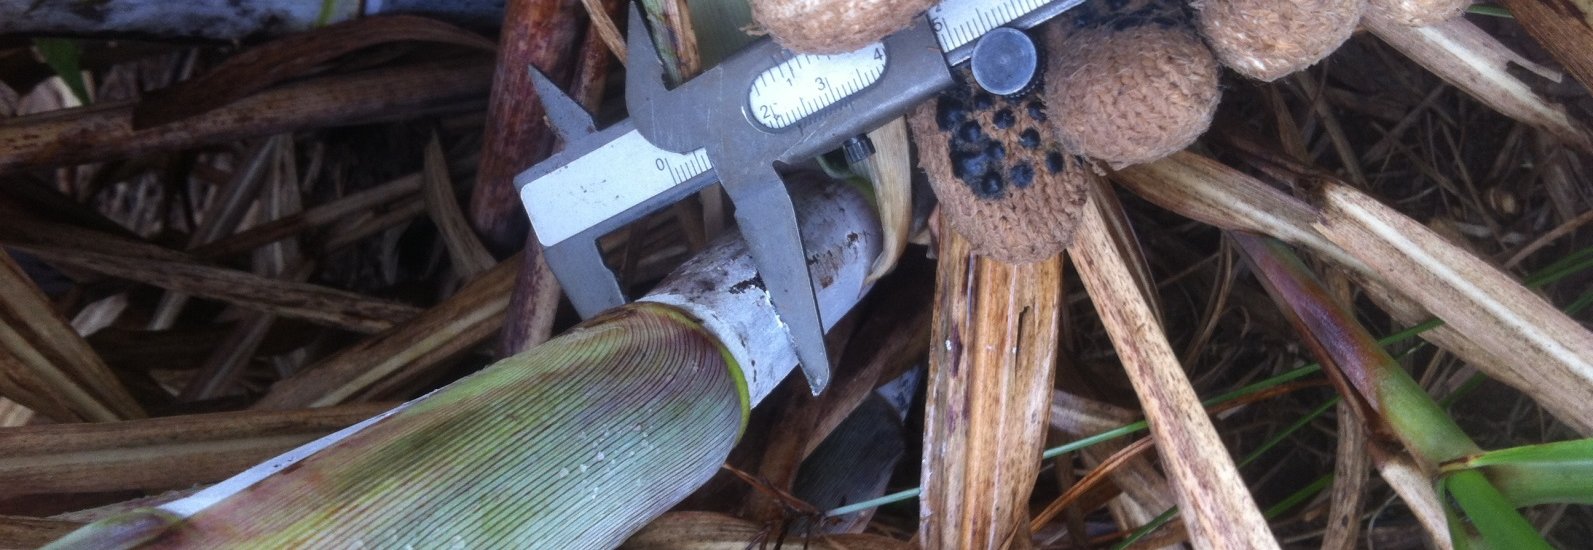
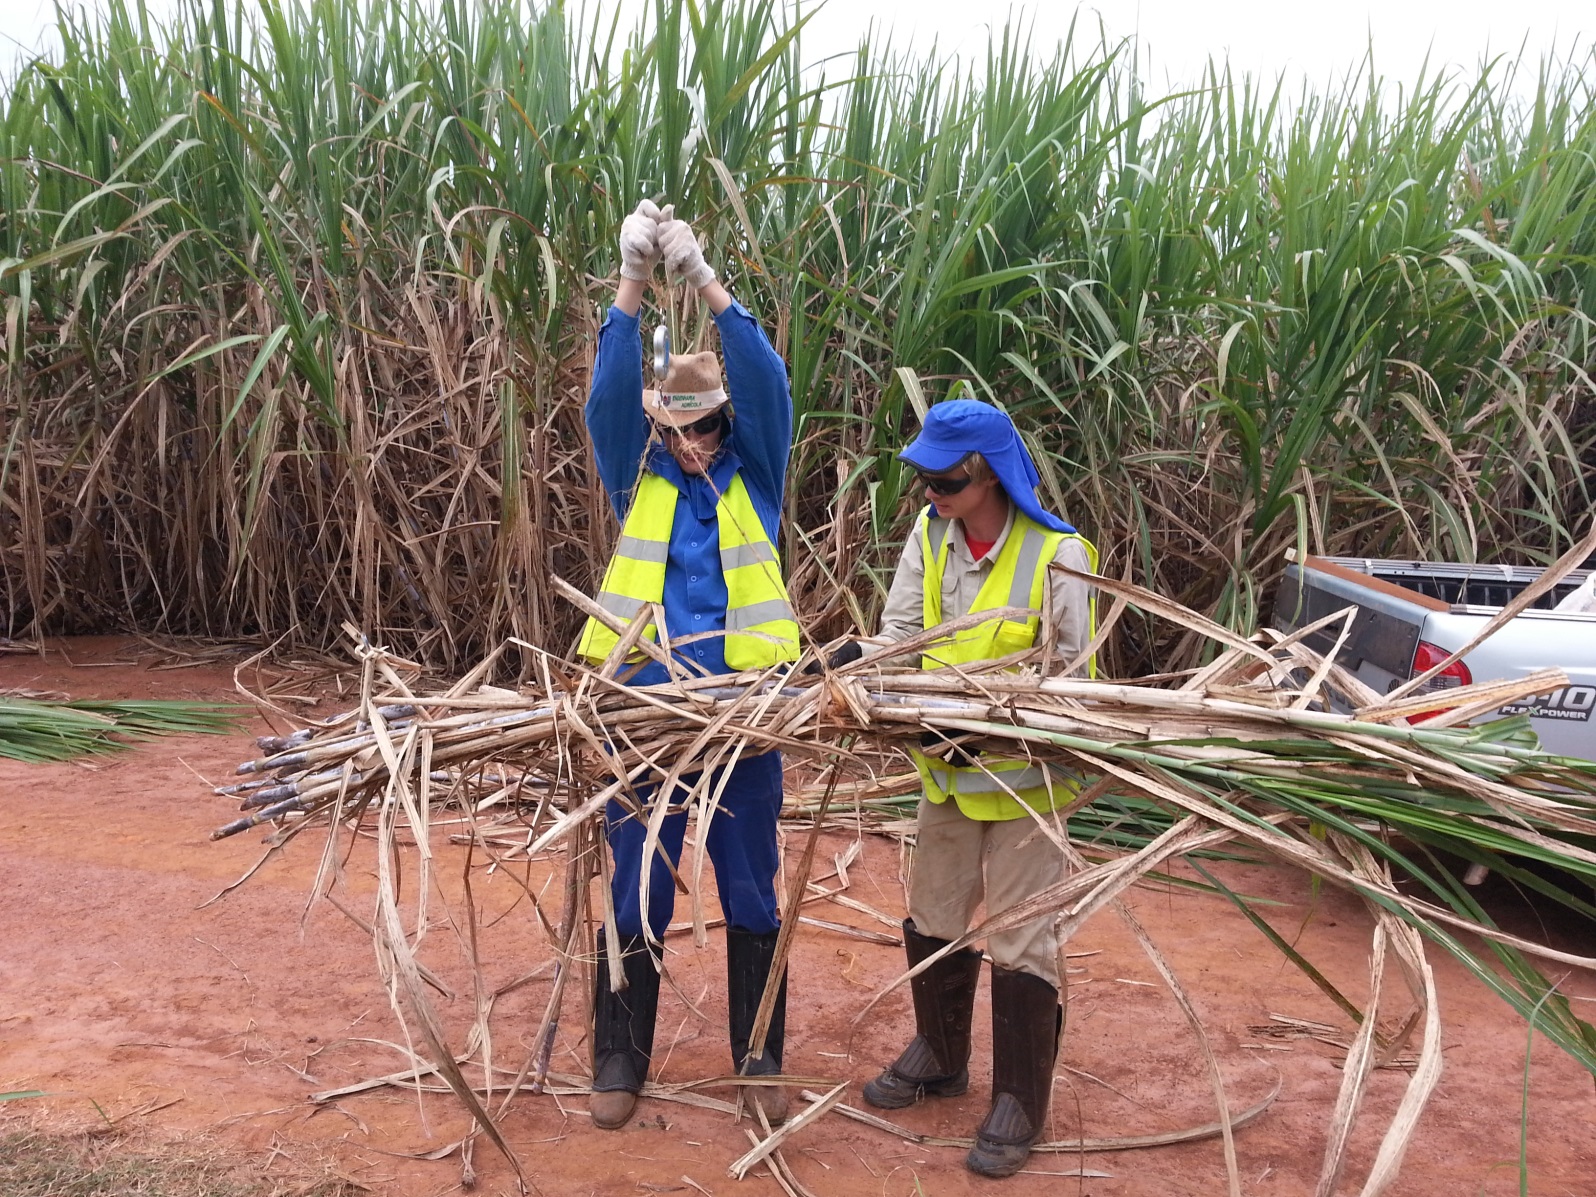
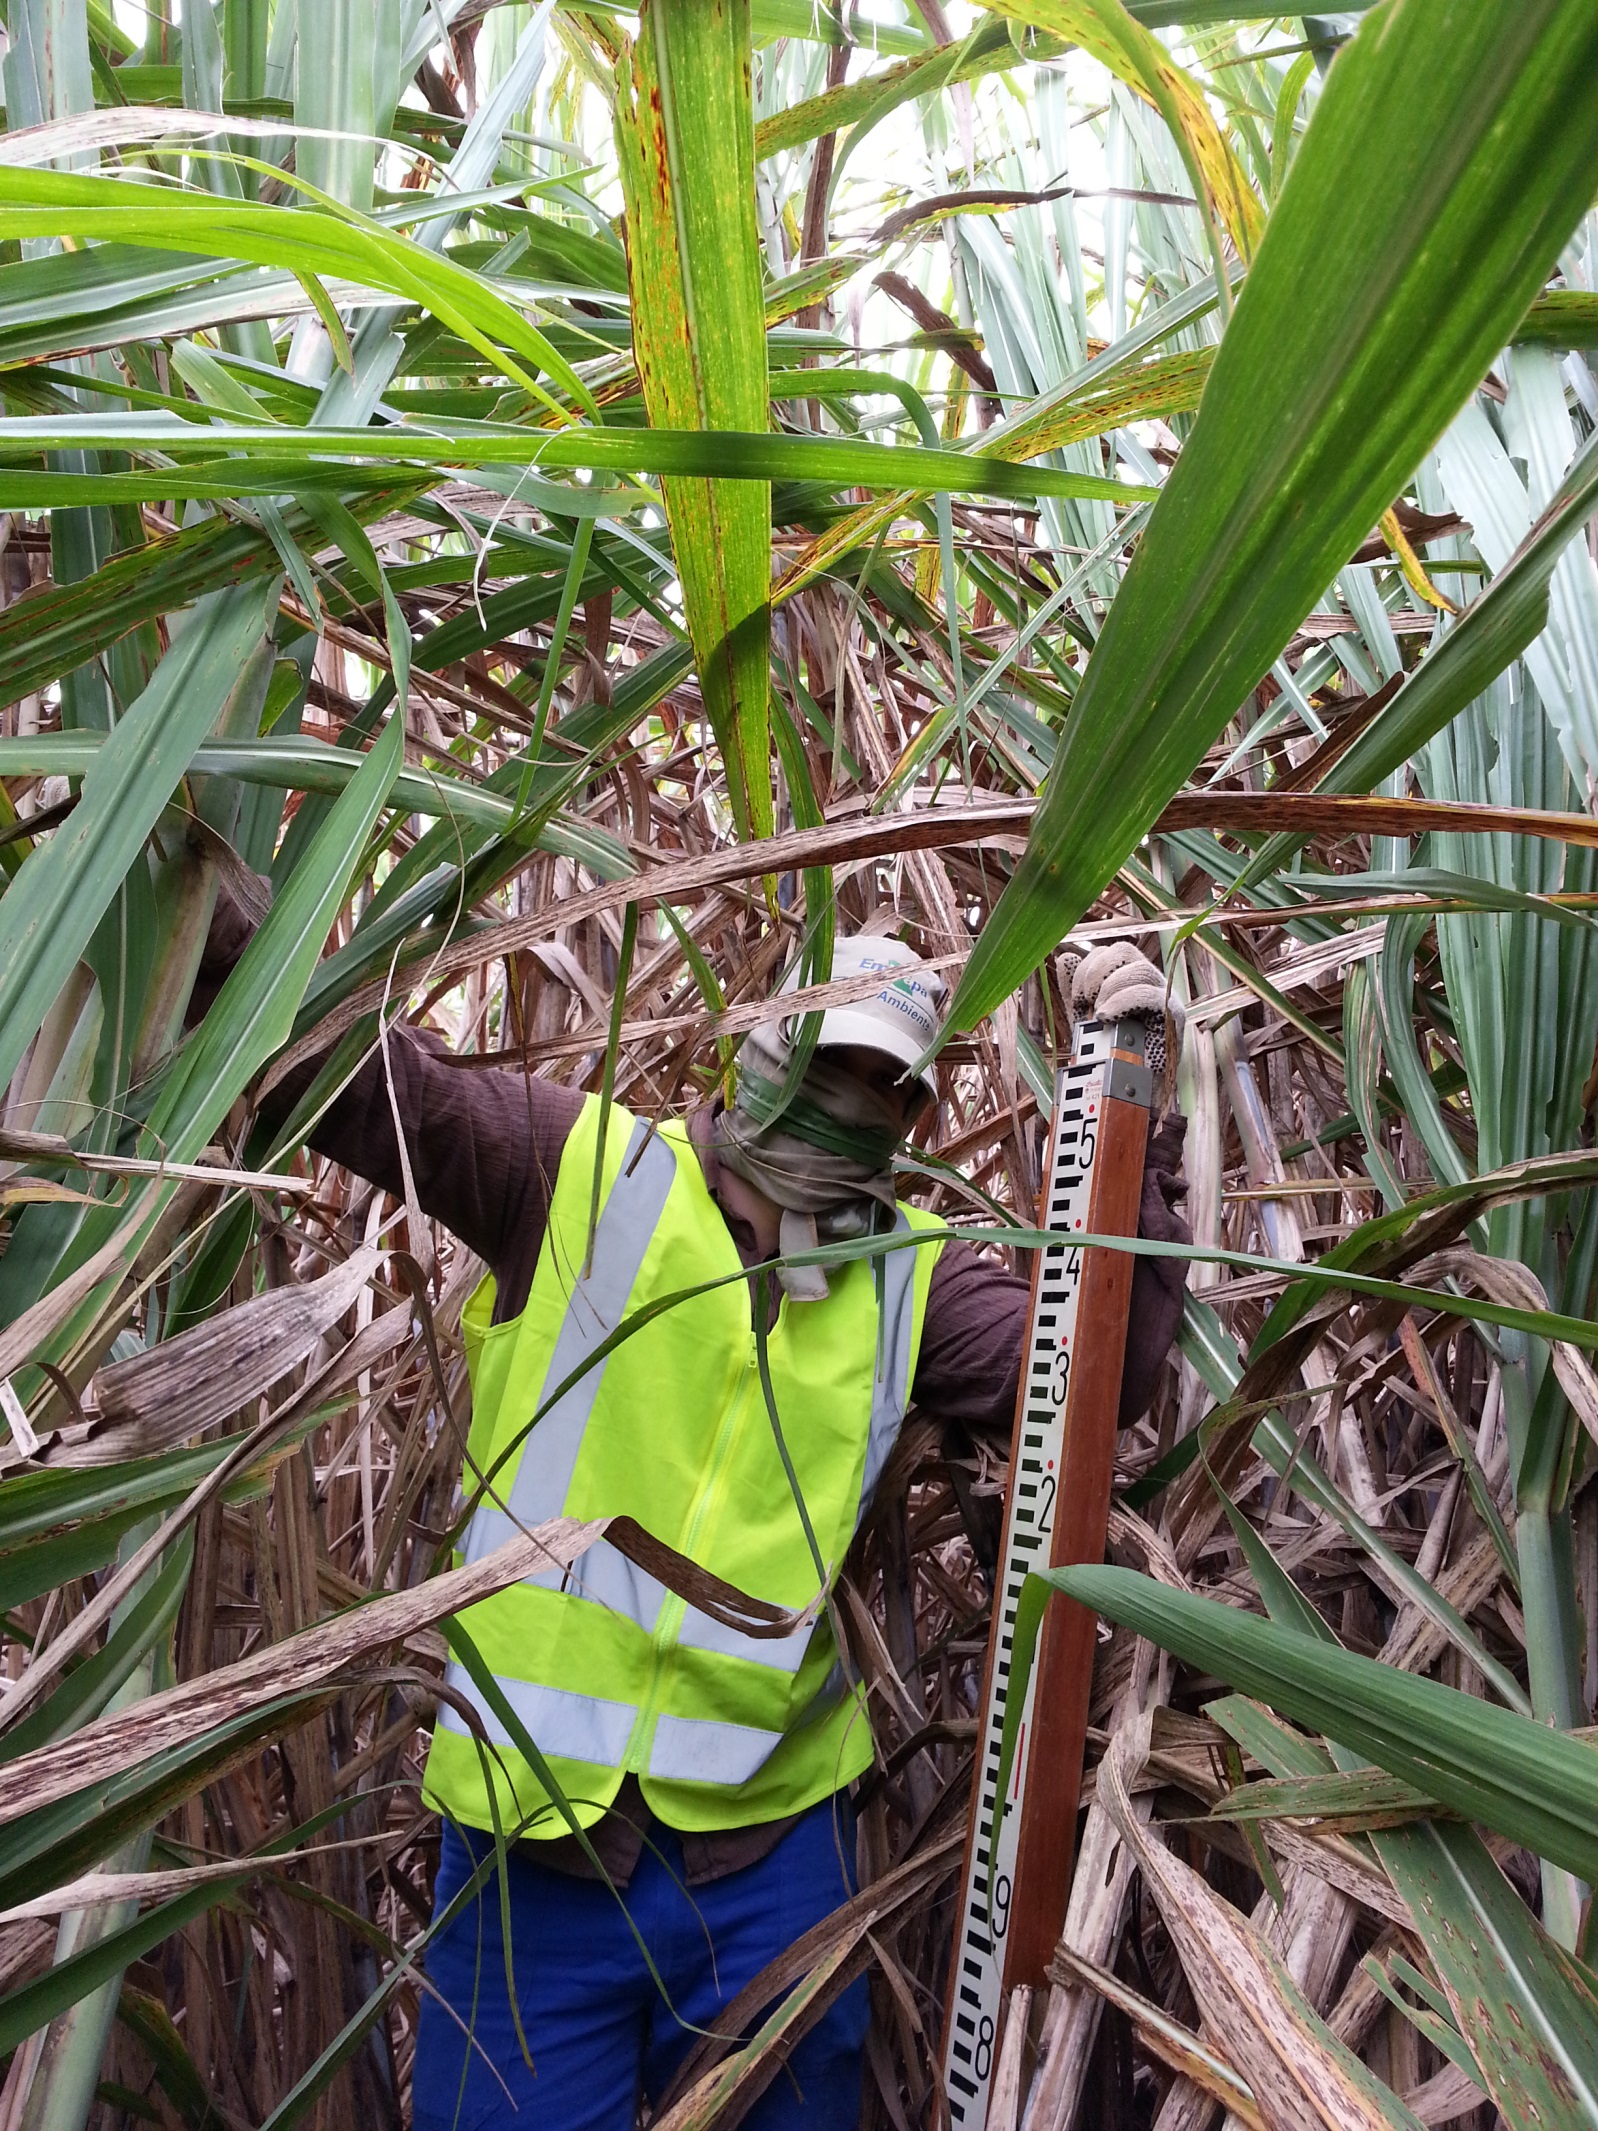
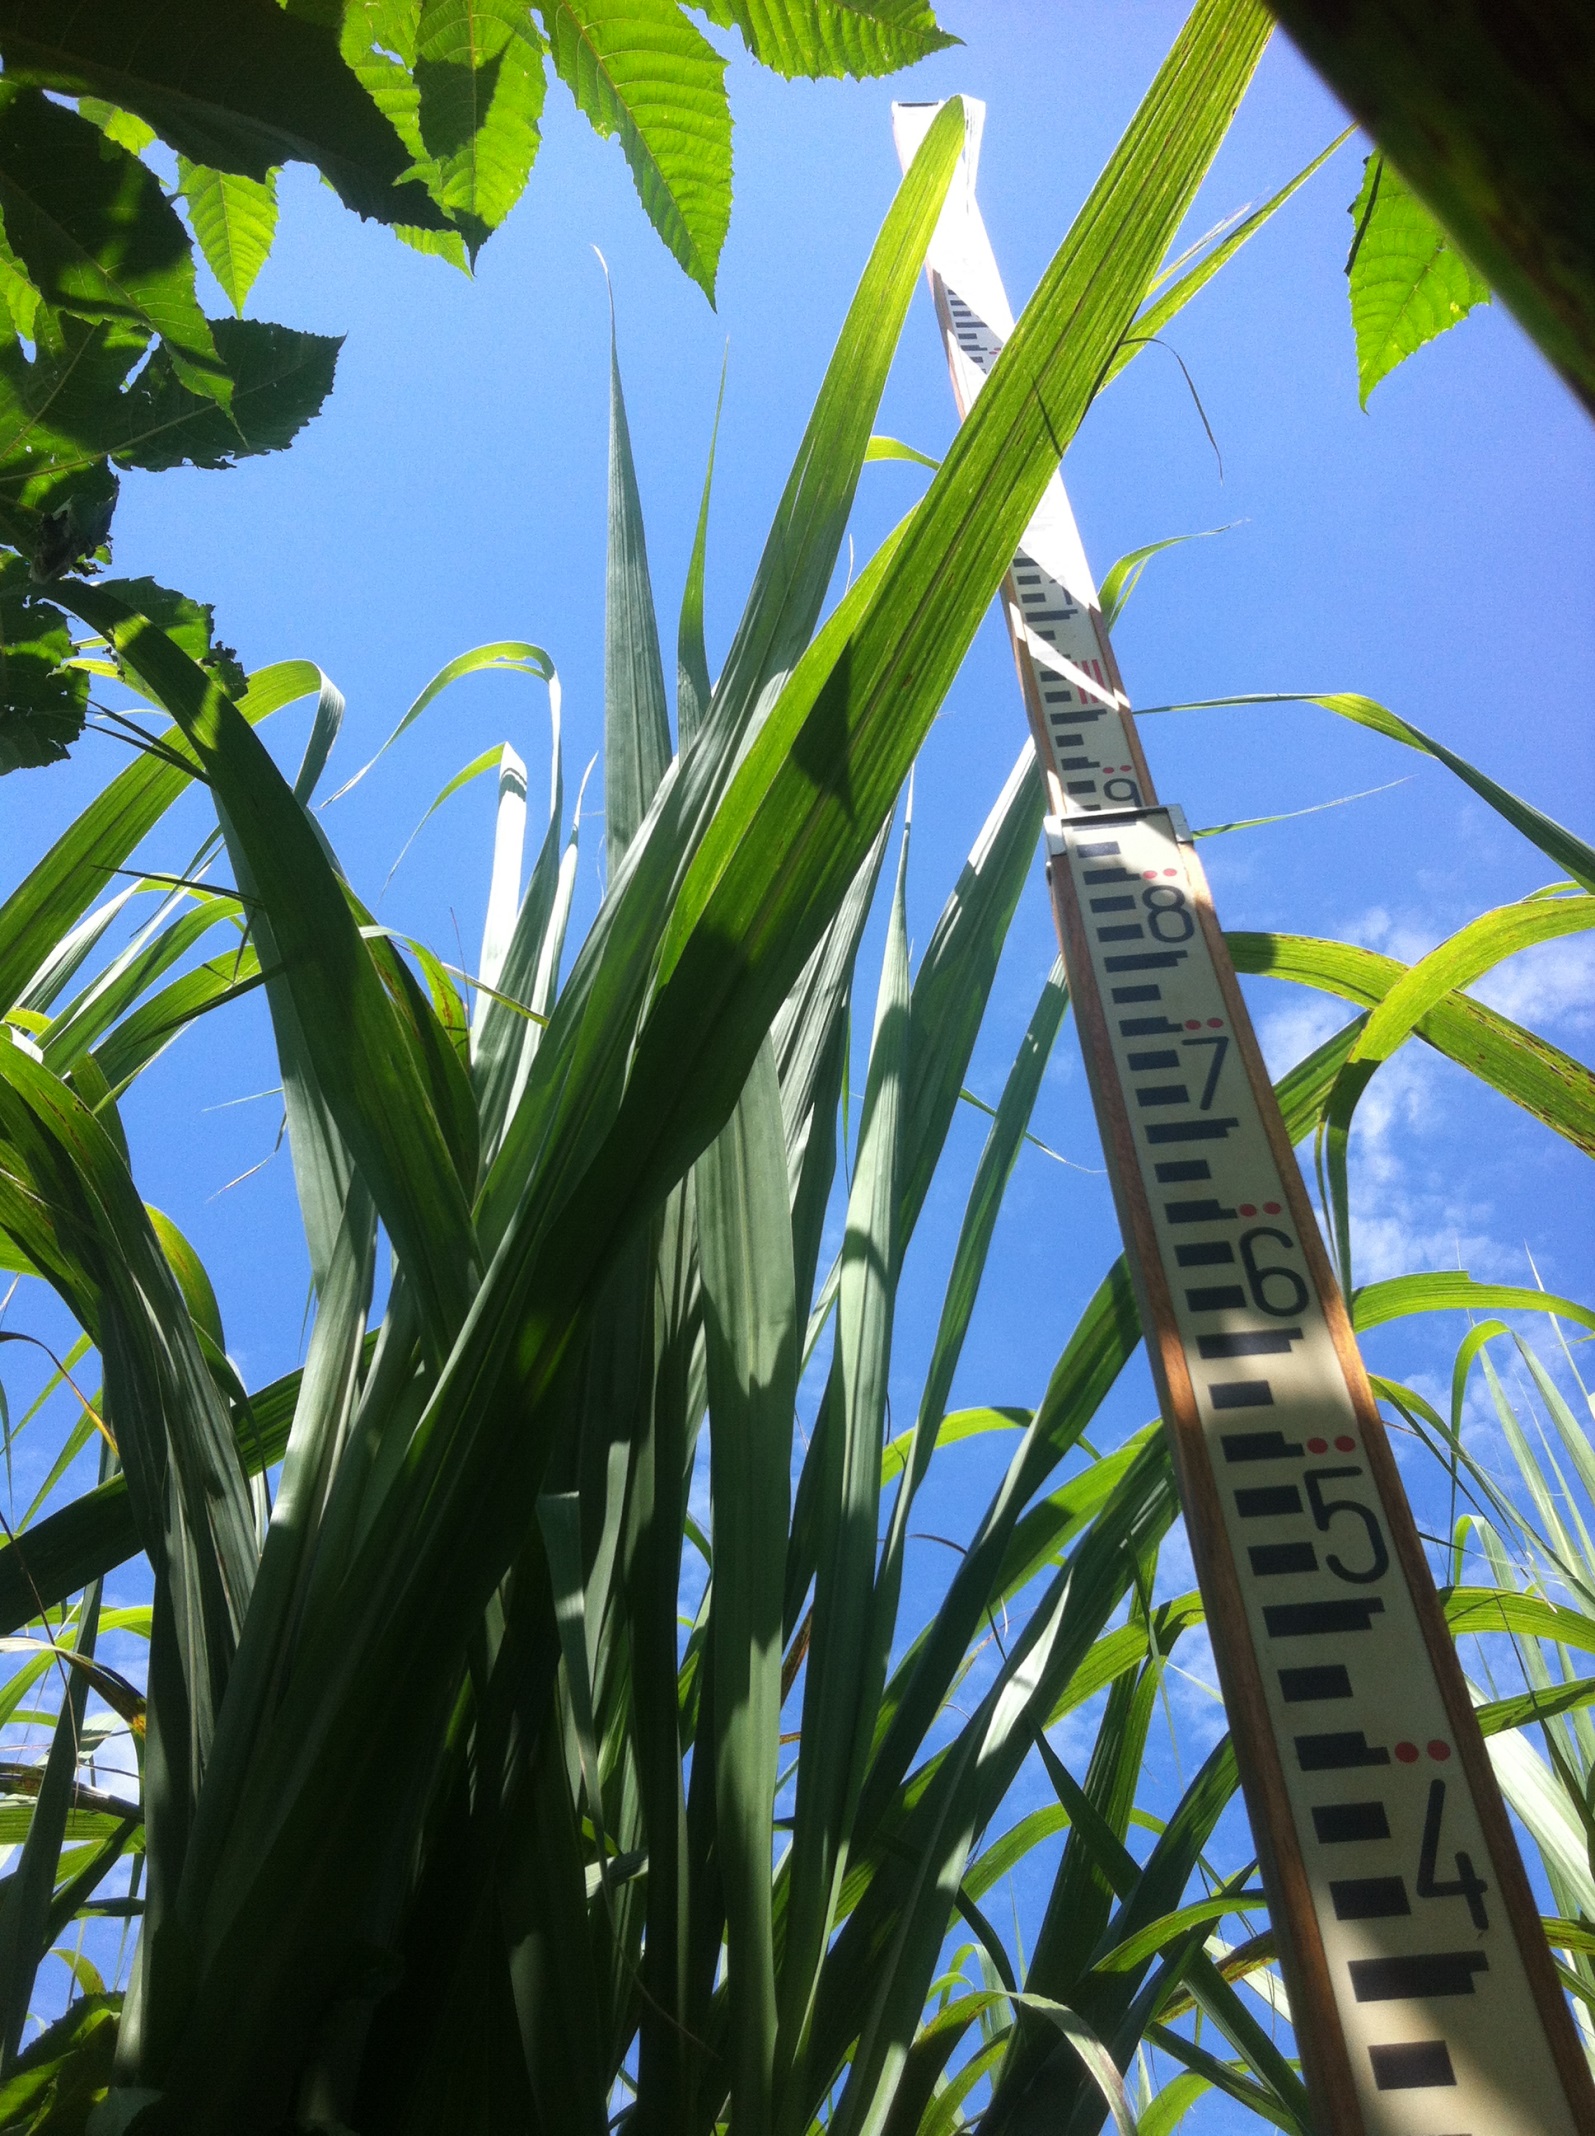
In order to check whether the model had processed the images correctly, Molijn headed for Brazil. With the help of his fellow PhDs from the University of Campinas he took thousands of measurements in areas with different types of land cover. They also spent many days measuring and weighing sugarcane to determine its biomass. The fieldwork was nothing if not intensive: ‘We worked 12 hour days. In order to reach the sugarcane fields we had to navigate an area of muddy tracks in a four-by-four. Sugarcane can grow to a height of 4 metres and the leaves are razor sharp. You need to cover yourself completely so as not to get cut, no matter what the temperatures. And in summer they can go up to 40 degrees.’
Big data
The results of Molijn’s research are impressive. His model makes it possible to distinguish between different types of land cover, such as pastures and woodland, and even between crops, like soy beans and sugarcane. He then went on to analyse the changing land cover of the state of São Paulo, an area six times the size of the Netherlands. He created a massive dataset from Remote Sensing data from 2003 to 2015. A super computer allowed him to process this whopping 3.3 terabytes of big data in the space of two weeks. An ordinary computer could not have done it in fewer than 18 months. ‘It is quite a breakthrough,’ Molijn concedes. ‘A couple of years ago we could only have done this on a much smaller scale, and in less detail. We have now shown that you can apply the model on extensive areas, while preserving the detail. The model is scalable and that means it can be used for many different purposes, for example by the authorities to check if agricultural subsidies are being used appropriately, or in order to detect deforestation and illegal logging. Furthermore, farmers can use it to gain insight into their farmland: they can see where the sugarcane is growing more densely and which part of the field needs more attention.’’
Sustainable?
Molijn’s large-scale monitoring of the changes in land cover has been a success. His research has confirmed that the sugarcane cultivation in São Paulo has grown by more than 50%, mostly to the detriment of pastures and, in its wake, livestock farming. The cattle has not disappeared but has moved elsewhere: in the northern states rainforest has been replaced by pastures. It looks as though the production of sugarcane is having an indirect negative impact on the ecosystem. Molijn himself is not given to conclusions or recommendations based on his results. His measurements are objective. And he does not need to because the University of Utrecht is using them to develop sustainability models and formulate conclusions.
What next?
For now, Molijn’s focus is on publishing his research and finishing and defending his dissertation in both Delft and Campinas. But what about his research? ‘In 2013 we had to build the train as well as the track. Now the train is on the move and gathering steam. There’s plenty left to do, so I hope another doctoral candidate will jump aboard!’
Meer informatie
- Be-basic - Societal Embedding of a Biobased Economy
- TU Delft - Produced maps of Sao Paulo state
- Universiteit Utrecht - Sustainability
Published: July 2017
