New land subsidence map reveals the Netherlands’ (in)stability
Lopsided houses, subsiding streets, shifting dykes and nature reserves stricken by drought.
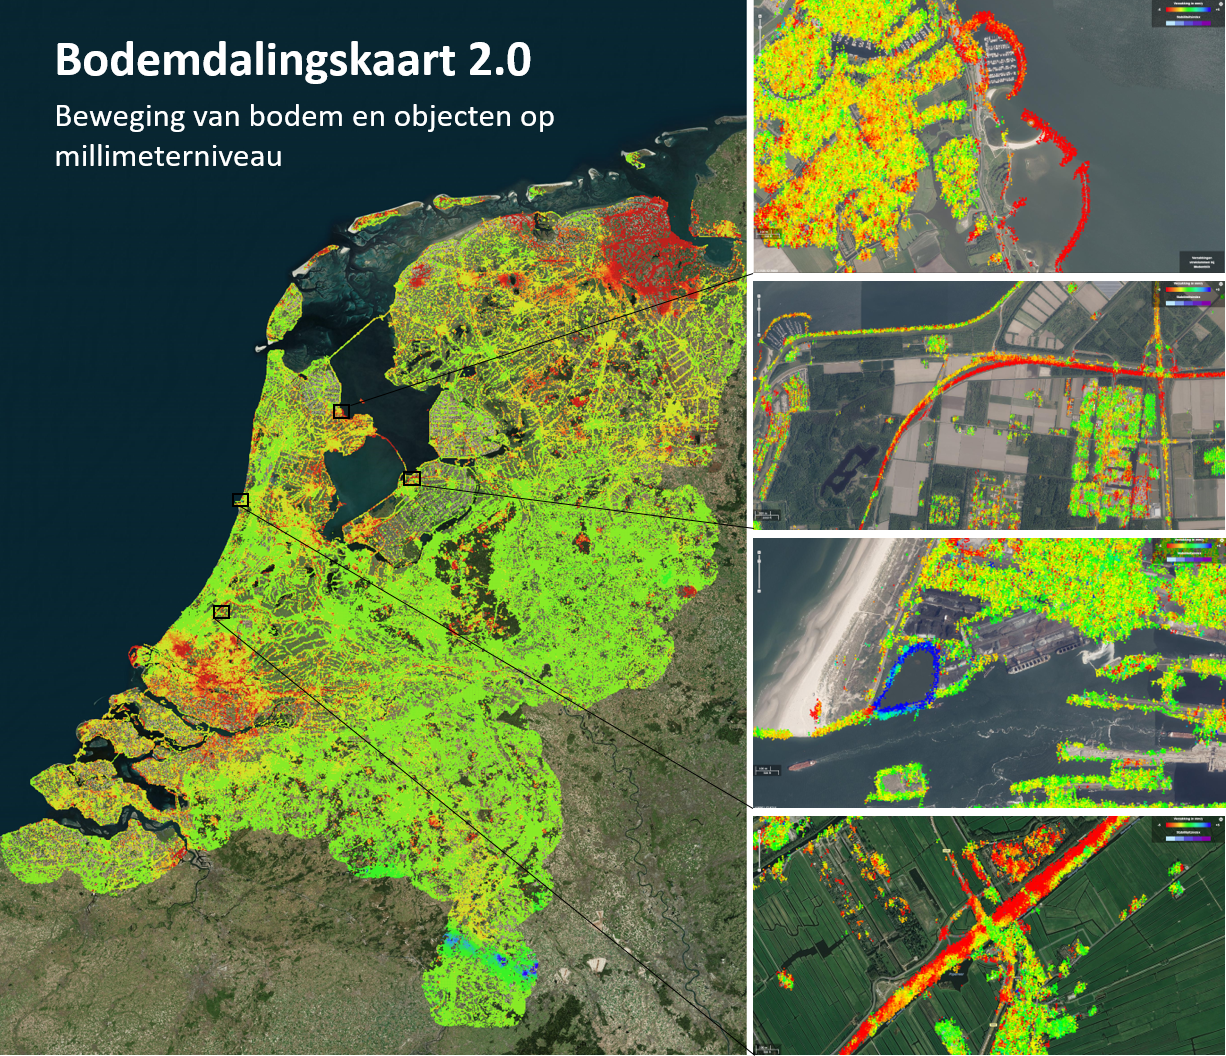
In the years ahead, there will need to be some serious investment in maintenance by citizens, businesses and government. All of this is revealed in the updated interactive Land Subsidence Map of the Netherlands, published online today. The data can be consulted at https://bodemdalingskaart.nl (Dutch).
Forty billion measuring points
Published jointly by the Netherlands Center for Geodesy and Geo-informatics (NCG), SkyGeo and TU Delft, the map shows the movement of billions of measurement points across the entire country. Whereas data of this kind previously needed to be collected manually, radio satellites have now been used, enabling new readings to be taken from each measurement point every few days. This provides a much more granular picture than the previous version of the map. In the first version, the satellite data were averaged out to boxes of four square kilometres. The new version shows each individual measuring point: more than 40 billion in total.
Movement of bridges, railways and buildings
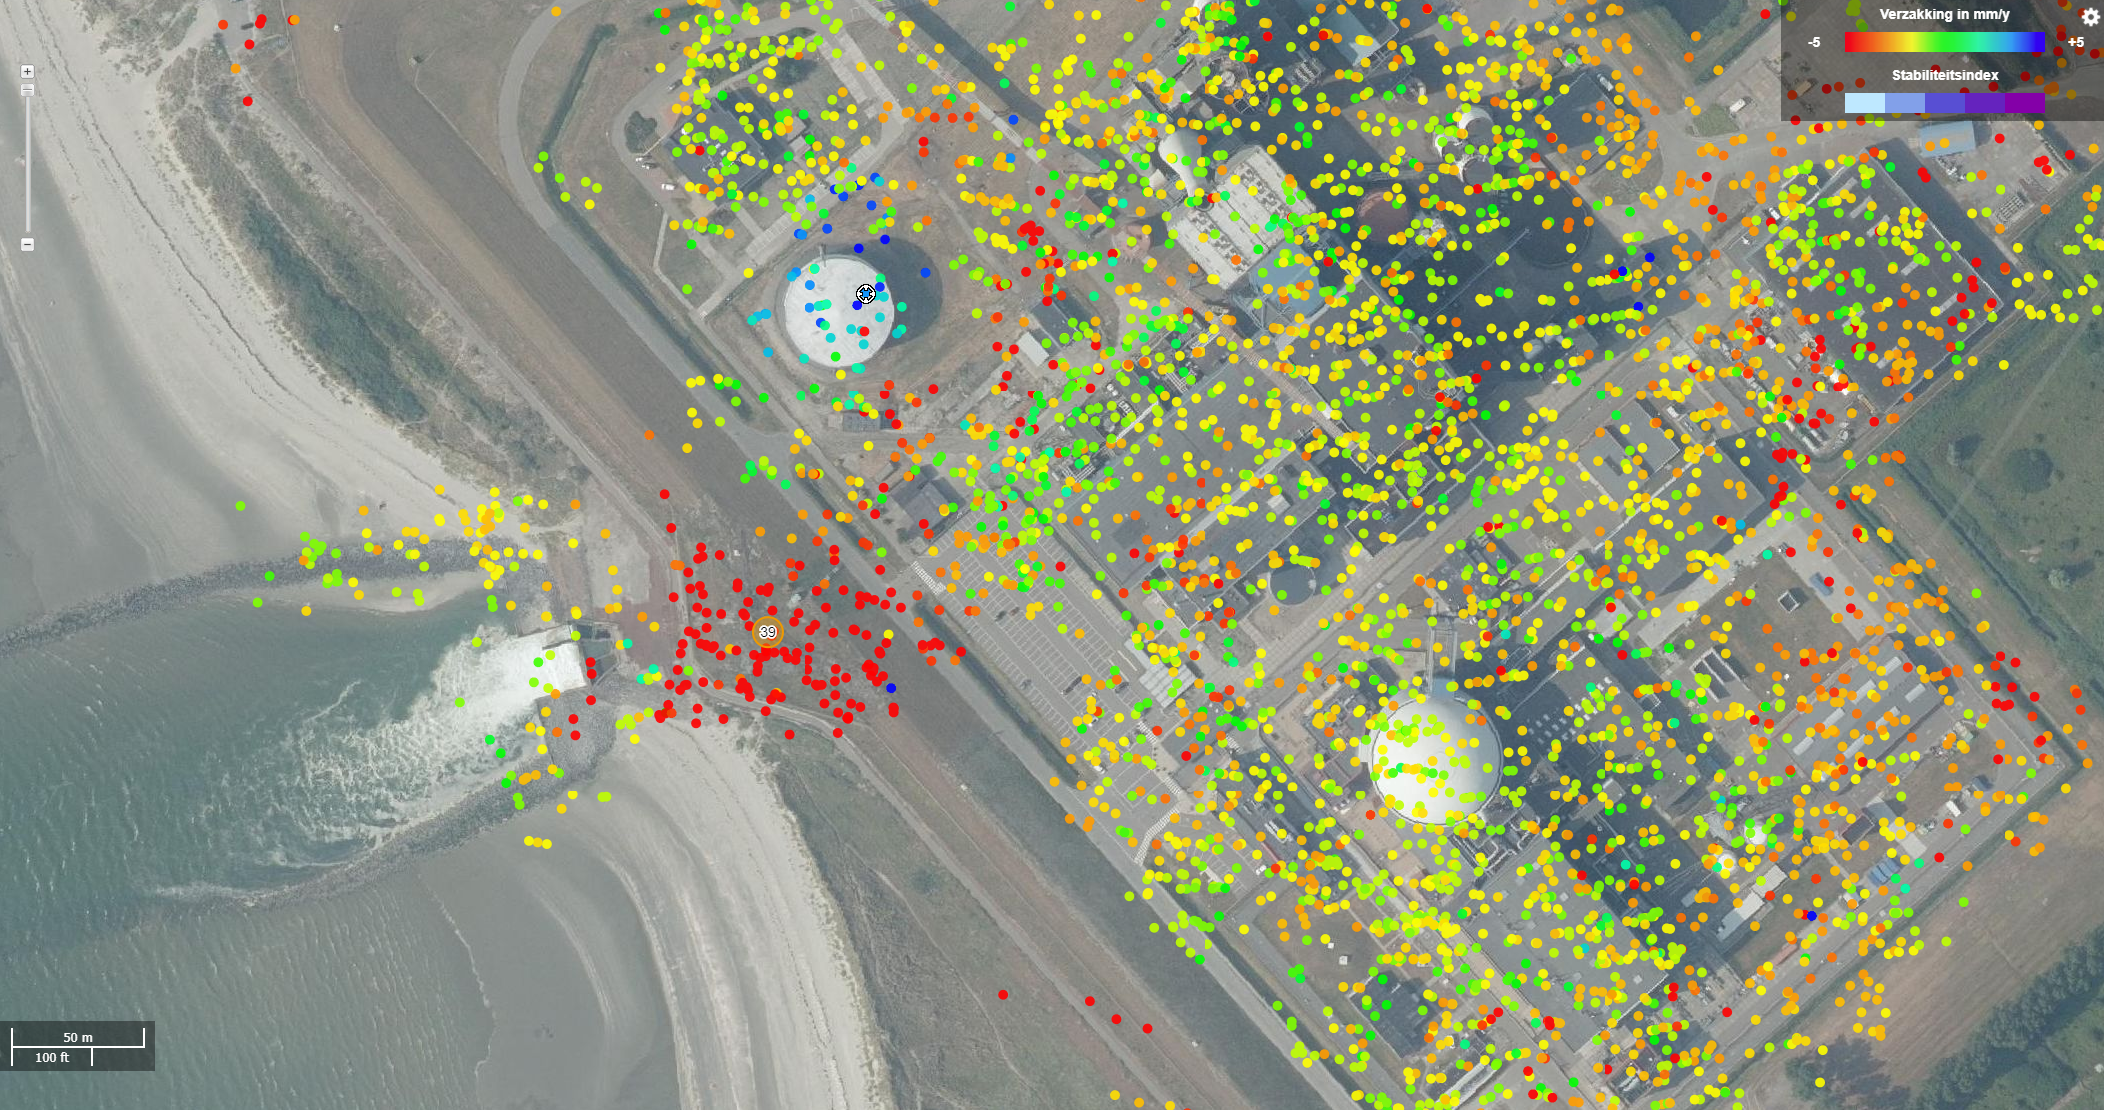
‘One major difference compared to the earlier version of the land subsistence map is that the data not only shows the movement of land, but also that of all kinds of objects, such as bridges, the railways and buildings’, says SkyGeo's Pieter Bas Leezenberg who processed the satellite data. This enables numerous parties, including local municipalities and managers of infrastructure, to check where maintenance is needed. The map shows clearly where dykes are sinking and heathland is settling, as well as the fact that the water outlet of the nuclear power station at Borssele is subject to subsidence.
Hesitant
Initially, the team was hesitant about publishing this information. Although the measurements are accurate down to the millimetre, a lot of knowledge of the satellite technology used is needed to correctly diagnose the cause. Despite this, the new version of the land subsidence map will be of relevance to a wider public. According to TU Delft's Professor Ramon Hanssen, some of the measurements can be used immediately and may prompt people to take action. Others are more difficult to interpret and will need to be further investigated by experts. ‘This map really shows how incredibly intensively we use our country’, says Hanssen. ‘It highlights how important it is to take care in interpreting the data. What we are actually seeing is the interaction of a radio signal from a satellite with objects on the Earth’s surface, and it requires specialist knowledge to interpret that.’
The Netherlands’ instability
What is clear is that the Netherlands faces huge investments when it comes to maintaining infrastructure affected by subsidence. It is not confined to roads, sewers, railways and dykes; industrial complexes and buildings are also showing signs of instability. This concerns government, businesses and citizens alike.
Continuous monitoring
The bodemdalingskaart.nl project has been developed by the Netherlands Center for Geodesy and Geo-informatics (NCG), the same organisation that initiated the Amsterdam Ordnance Datum (NAP) water-level measurements, designed the first continuous Netherlands’ GPS network and pioneered the Actual Height Model of the Netherlands (AHN). Various universities, knowledge institutions and businesses are also contributing to the result: TU Delft, Royal Netherlands Meteorological Institute (KNMI), HU University of Applied Sciences Utrecht, University of Twente, SkyGeo and 06-GPS. The team is working on the further development of the technology to enable objects and land to be monitored on a continuous basis, which will also make it possible to respond more swiftly in cases where any movement could lead to a potential disaster.
More information
Contact info: https://www.tudelft.nl/hanssen/
TU Delft Science Communication Adviser Roy Meijer, r.e.t.meijer@tudelft.nl, +31 6 14015008
Images, with several local Dutch locations: click here


