Most people like to keep both mathematics and epidemics at a distance. But a little bit of the former can do wonders in limiting the latter. Supervised by professor Kees Vuik, two high school students modelled a recent outbreak of cholera in Ghana. He also has a bachelor student investigating the new corona virus.
‘For ten years I have used the course of small outbreaks and large epidemics to introduce the concept of mathematical modelling to new university students,’ says Kees Vuik, professor in the Numerical Analysis group at TU Delft. ‘Although we do explore some mathematical depths, these models are essentially relatively straightforward. It would be great if everybody gained some insight into these models. We would then better understand why certain measures are, or are not, taken in an effort to control the course of an epidemic.'
With a bit more insight into disease modelling we would all better understand why certain measures are taken to constrain an epidemic.
The dynamics of a ‘simple’ epidemic
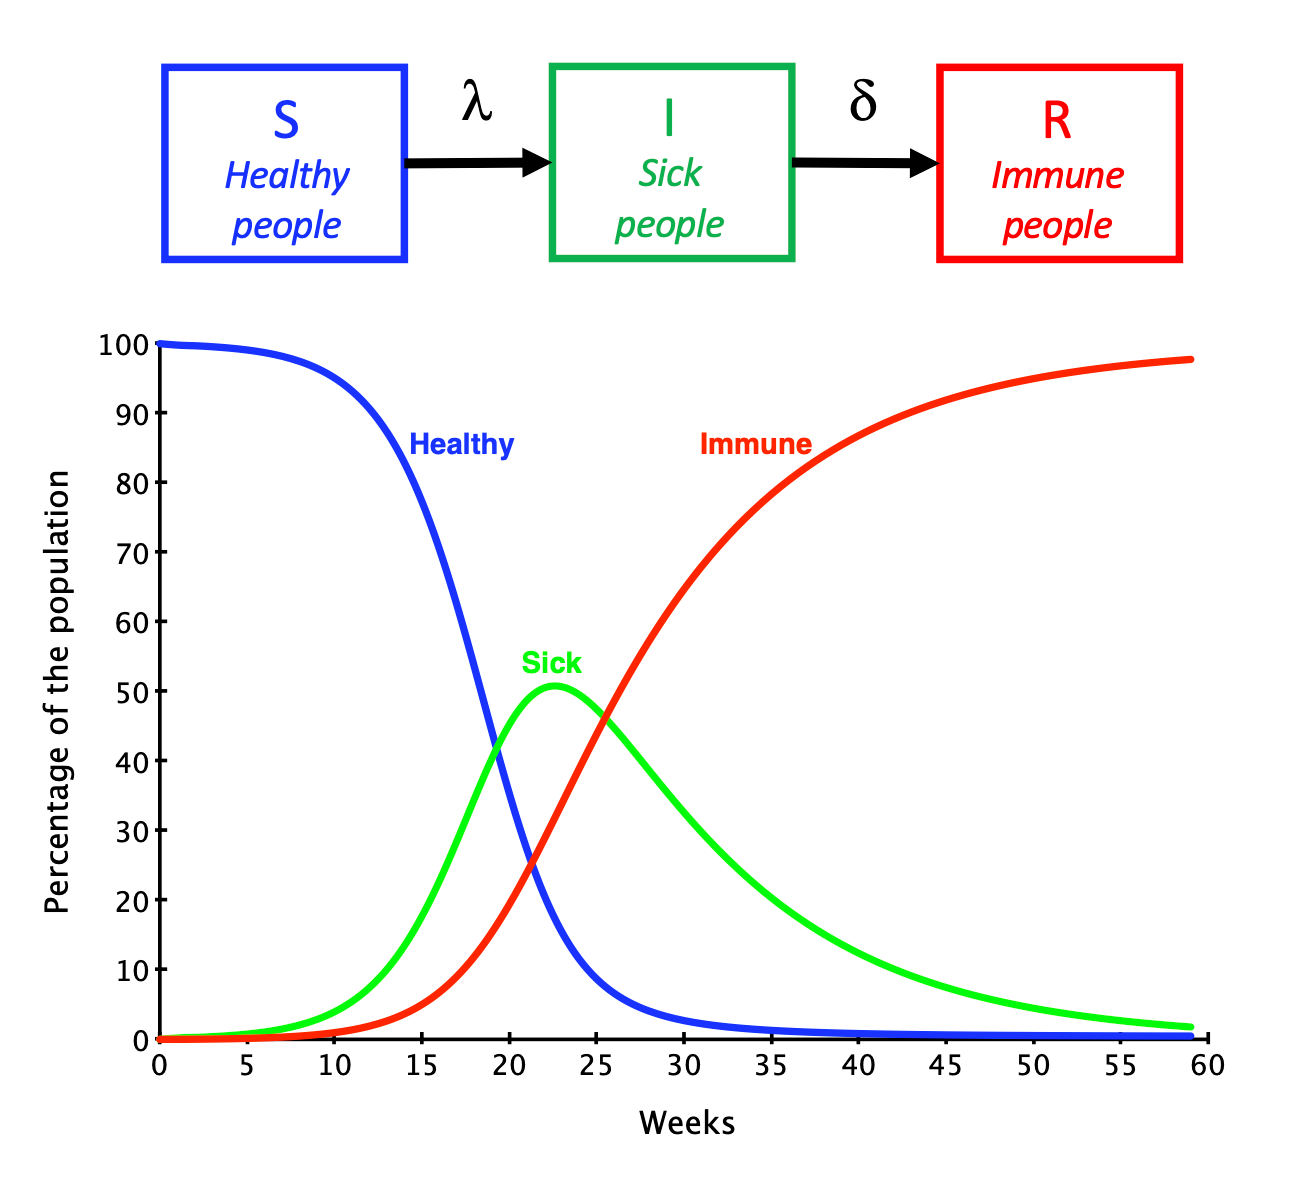
For well-known diseases such as the flu, measles, mumps and rubella, the course of an epidemic can be accurately predicted using the SIR model (see figure). It requires the population to be divided into three groups, so-called compartments: Healthy people, Sick people and Immune people. Those in the group of Healthy people have a certain chance to fall ill, and thereby move to the group of Sick people. The chance of falling ill increases as the number of people that are already sick and therefore contagious increases. Those in the group of Sick people have a certain chance to recover and to thereby move to the group of Immune people. This very straightforward model correctly predicts there to be a peak in the number of sick individuals. The magnitude and timing of this peak depends on two coefficients. The first coefficient is a number, the value of which signifies the speed of sick people infecting healthy people. The value of the second coefficient signifies the speed of recovery of sick people. The model can be extended with aspects such as vaccinations or a latent period during which a person is infected but not yet contagious. It is harder to mathematically solve such an extended model.
We wanted to do a project involving mathematics and we wanted it to have social relevance.
Cholera in Ghana
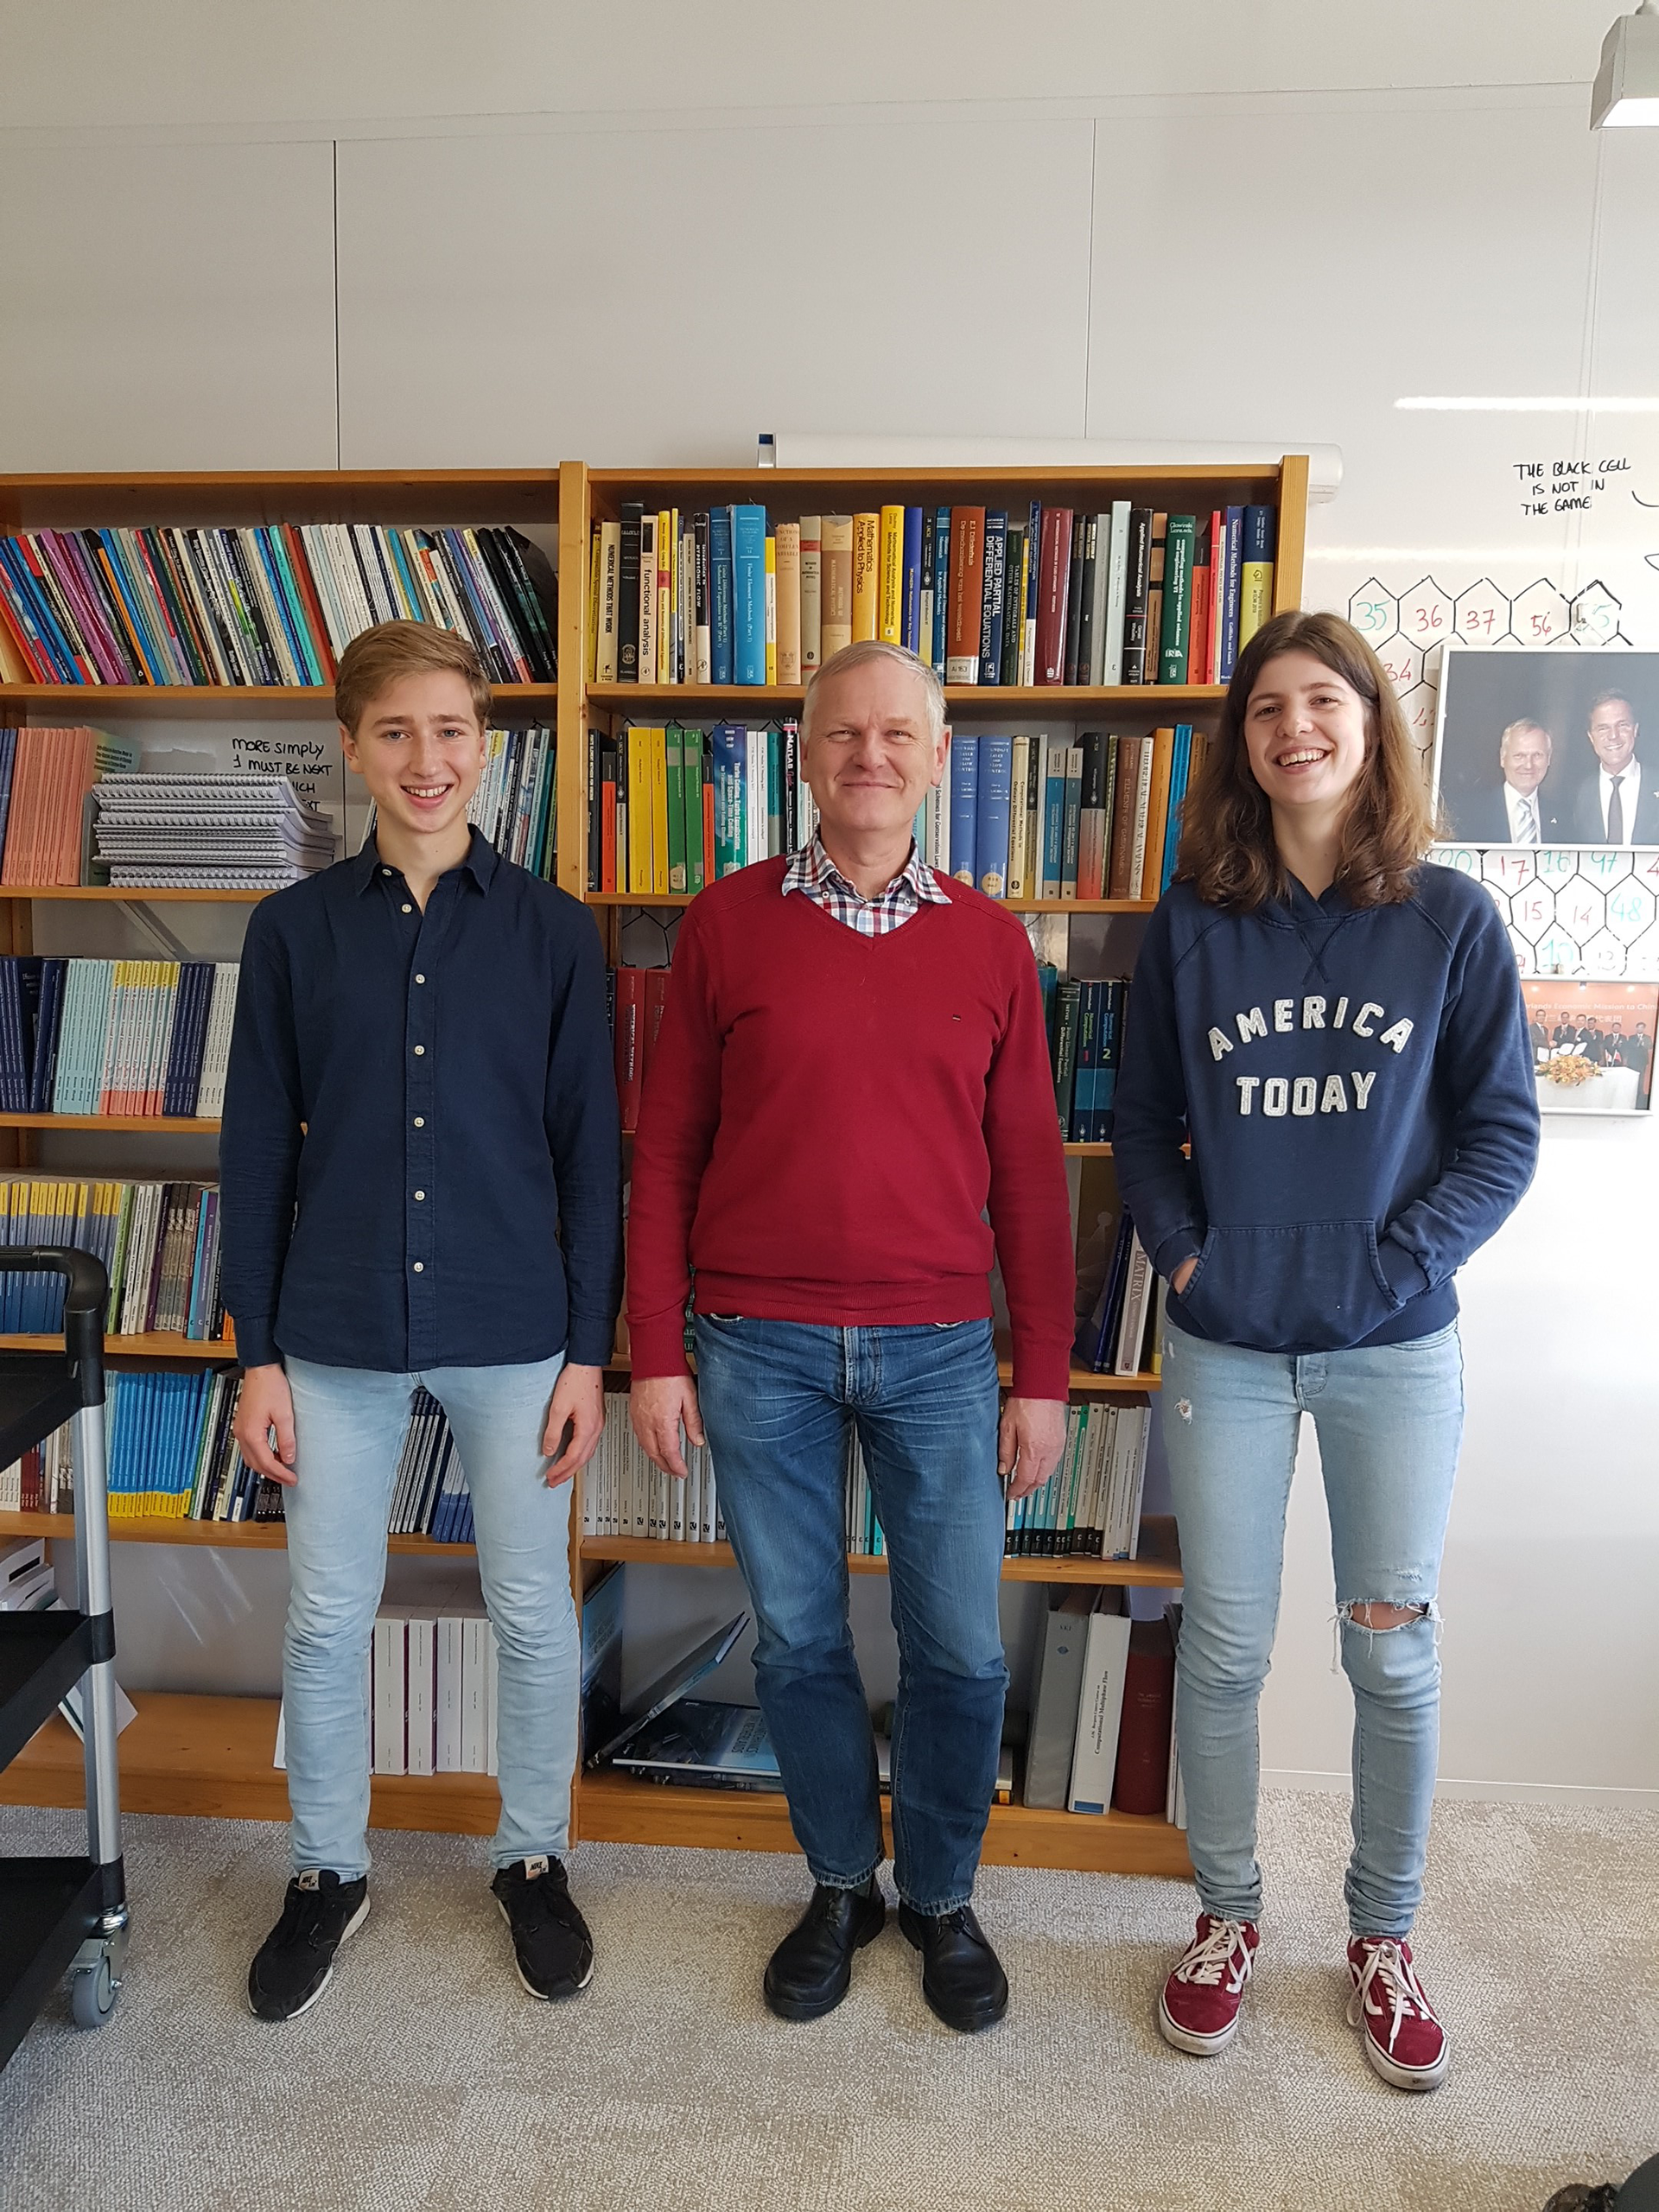
‘Early last year, at a conference, I saw a poster describing a disease model for cholera,’ Vuik says. ‘The model showed two pathways for the cholera bacterium to be transmitted – from one human directly to another, and through contaminated drinking water. That was new to me. I then asked two high school students to try and apply this model to a recent outbreak of cholera in Ghana.’ In 2014, more than seventeen thousand people were infected by cholera, with about three hundred of those not surviving. The two students, Annelotte Baarslag and Mark Tabaksblat of Gymnasium Novum in Voorburg, had just been accepted to the Pre-University College of Leiden University and were eager to get their teeth into it. ‘We had many assignments to choose from for our final research project. We wanted to do a project involving mathematics and we wanted it to have social relevance. Modelling a disease outbreak was very appealing to us.’
A simple disease model for corona
A bachelor student supervised by professor Vuik is currently investigating if a simpler disease model can (still) be adequate for understanding why certain measures are proposed to constrain the current corona epidemic, such as closing our airspace to flights from certain high-risk countries. The student will specifically try to explain how this virus was able to spread around the world so quickly. To answer this question, he will model the influence of long-distance travel in combination with the probability of being contagious while not yet experiencing any symptoms. ‘I think it may be interesting to add a fourth category to the SIR model, a contagious-but-not-yet-ill compartment,’ says professor Vuik. ‘The most important aspect of this research is educating student. It is not our aim, or our expectation, to discover something that is of interest to the RIVM, but it is certainly a possibility.’
No longer contained
‘We had to learn some additional math skills,’ Mark says, ‘but we could still explain our research and the model we used to our classmates and family. Not so much how to solve the model using numerical analysis, but certainly the various dependencies in the model and how they influence each other as well as the course of the outbreak.’ The students first gained experience by applying the simple SIR model to an outbreak of influenza. They subsequently focussed their attention on the more difficult model for cholera, including the additional infection pathway through contaminated drinking water. The model was also extended by including both birth and natural death. Next to assuring that a model correctly represents all relevant dependencies, another big challenge is to determine the correct values of all its coefficients. ‘At first, Mark and Annelotte were a bit hesitant to as much as change the value of a single coefficient,’ Vuik explains. ‘But as soon as they saw the predicted course of the epidemic to much better match the measured rate of infections and deaths, they could no longer be contained. They doubted the correctness of all coefficients and they even changed a dependency in the model.’
The SIR-model
The SIR model has three compartments: Susceptible (Healthy), Infectious (Sick) and Recovered (Immune). As the number of healthy people continually declines (blue dots), the number of sick people will first rise and then fall (green dots). The epidemic comes to an automatic halt. In the end, everybody has fallen ill and become immune (red dots).
A sewage system but no quarantine
‘With our model matching the outbreak in Ghana we could investigate the measures available to the authorities to constrain an outbreak of cholera,’ Annelotte says. ‘We for example lowered the value of the coefficient representing the speed with which the cholera bacteria transfers from humans to local waters. The authorities can achieve such a reduction by building a sewage system or by improving an existing one. Our model predicted this measure to reduce the total number of people being infected as well as the number of deaths caused by the outbreak.’ This was an expected outcome as, mid-19th century, the Netherlands halted cholera outbreaks by adding a sewage system and a pipeline network for drinking water to many of its cities. ‘Perhaps the most interesting outcome was that imposing quarantine measures has absolutely no effect in the case of cholera,’ Mark says. ‘Although it reduces the rate of infection between humans, everybody still ends up being infected through contaminated drinking water. Quarantine or not, the same number of people will succumb to cholera.’ Professor Vuik adds some nuance to this conclusion. ‘A quarantine does work if you do not only quarantine people, but also the contaminated water sources. This can be achieved by restricting access to an entire village or region. More comprehensive disease models therefore subdivide an area or country into various regions, while also modelling travel between these regions.’
And just to think that, at this moment, mathematicians are actually saving lives.
It’s in the details
‘The model we used to describe the cholera outbreak is quite advanced and at a scientific level,’ Vuik says, ‘but the real know-how is concentrated at the National Institute for Public Health and the Environment (RIVM).’ The institute houses twenty mathematicians dedicated to disease modelling. At this moment, with the corona outbreak, they work around the clock. ‘It is a new disease for which the model dependencies are well-known, but the epidemic has only just started,’ Vuik continues. ‘Each day brings new data, leading to changed insights and updated values of coefficients: contagiousness, the duration of the latent period, and so on – per age category.’ The models used by the RIVM are fundamentally similar to the students’ cholera model, but they are extremely hard to solve mathematically as they need to take so many details into account. The simple models assume every person to have a similar likelihood to be infected, and to be equally contagious once infected. The model of the RIVM applies different coefficients per age group and gender. They also take into account highly detailed information about the interactions between people – who meets whom, how often and where? It allows the RIVM to determine the effectiveness of countless and quite detailed measures, such as the closing of schools. ‘I currently also supervise a bachelor student. He is investigating whether or not some of these measures also follow from a simpler model (see frame).
A futuristic scenario with extended insight
“It is the year 2041. Following a first limited outbreak under high school students in Voorburg, mathematical understanding of disease models has spread all over the Netherlands. The entire city of Rotterdam is put under quarantine as, after nearly 200 years, it is unexpectedly hit by an outbreak of cholera in its port area. Nobody was surprised by this drastic measure and no parliamentary questions were tabled.”
The power of mathematics
Both high school students were already familiar with the power of mathematics prior to their modelling assignment. It is something they wish to continue to apply. Annelotte has been admitted to the navy and will be trained to become a maritime officer – a bachelor involving a lot of mathematics and physics. Mark will most likely enrol at Leiden University to study mathematics and physics. ‘The current corona epidemic is so overwhelming,’ he says. ‘And just to think that, at this moment, mathematicians are actually saving lives.’
Text: Merel Engelsman | Portrait photo: Mark Prins


