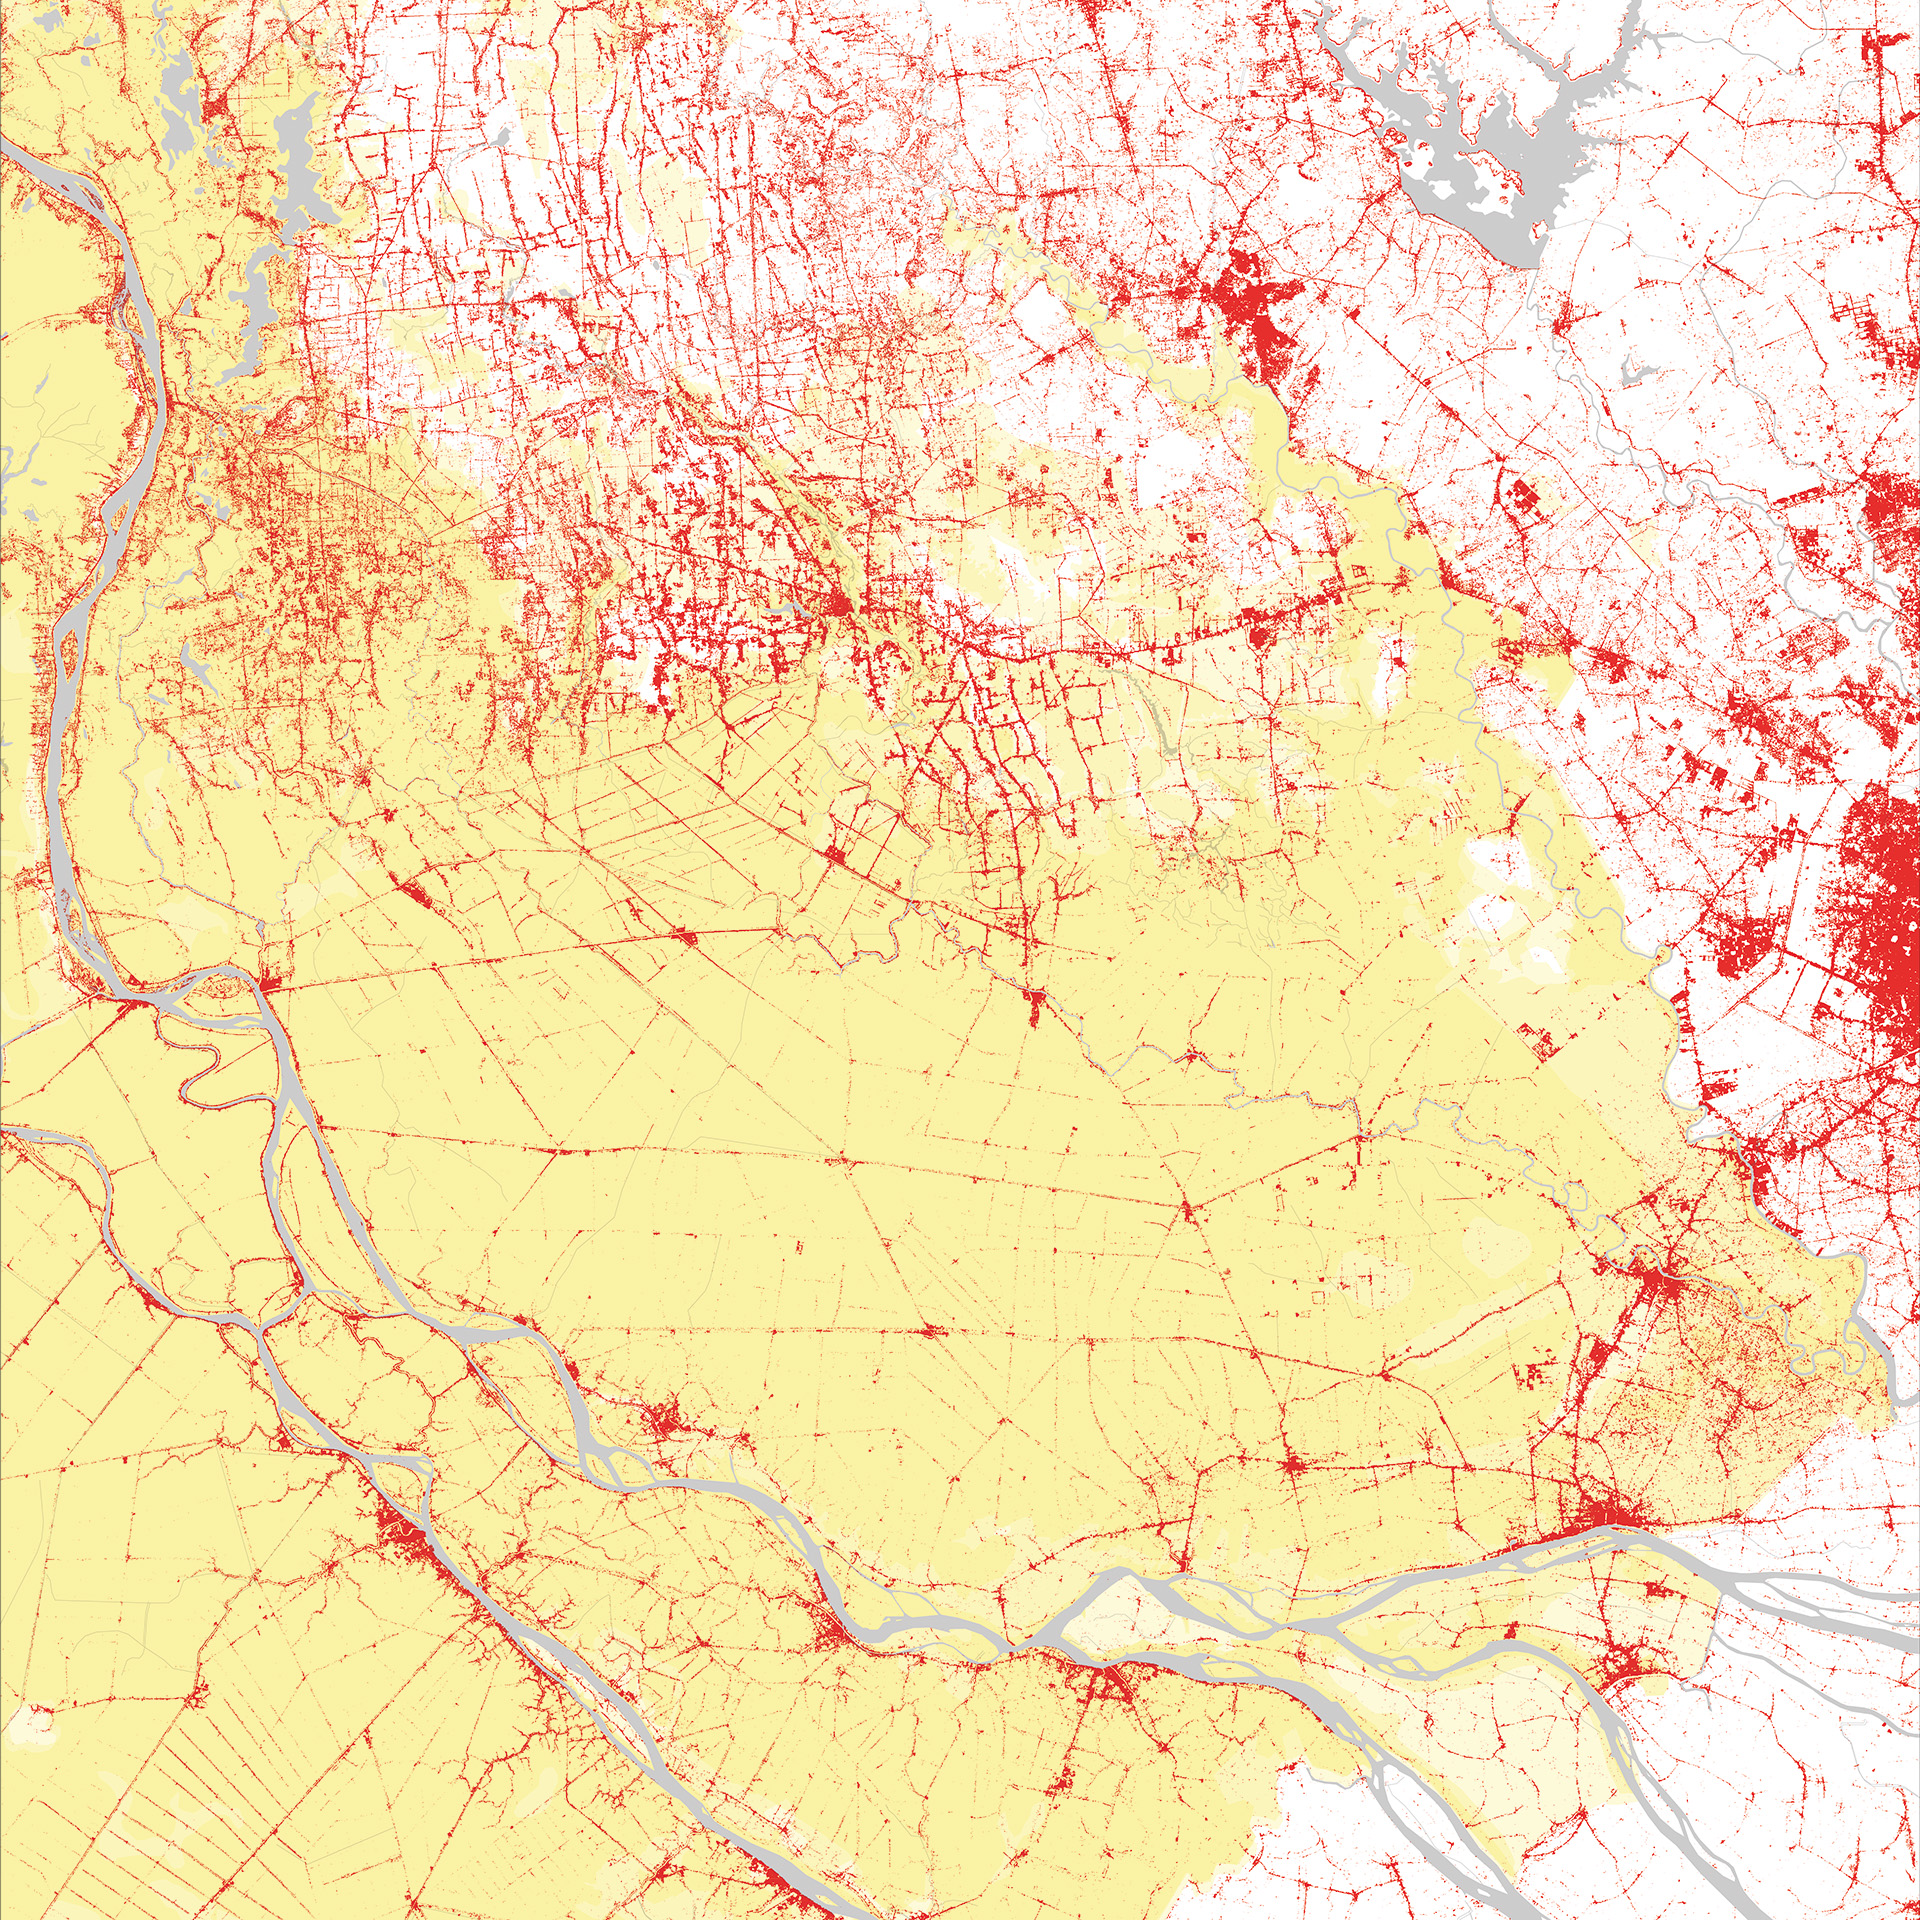
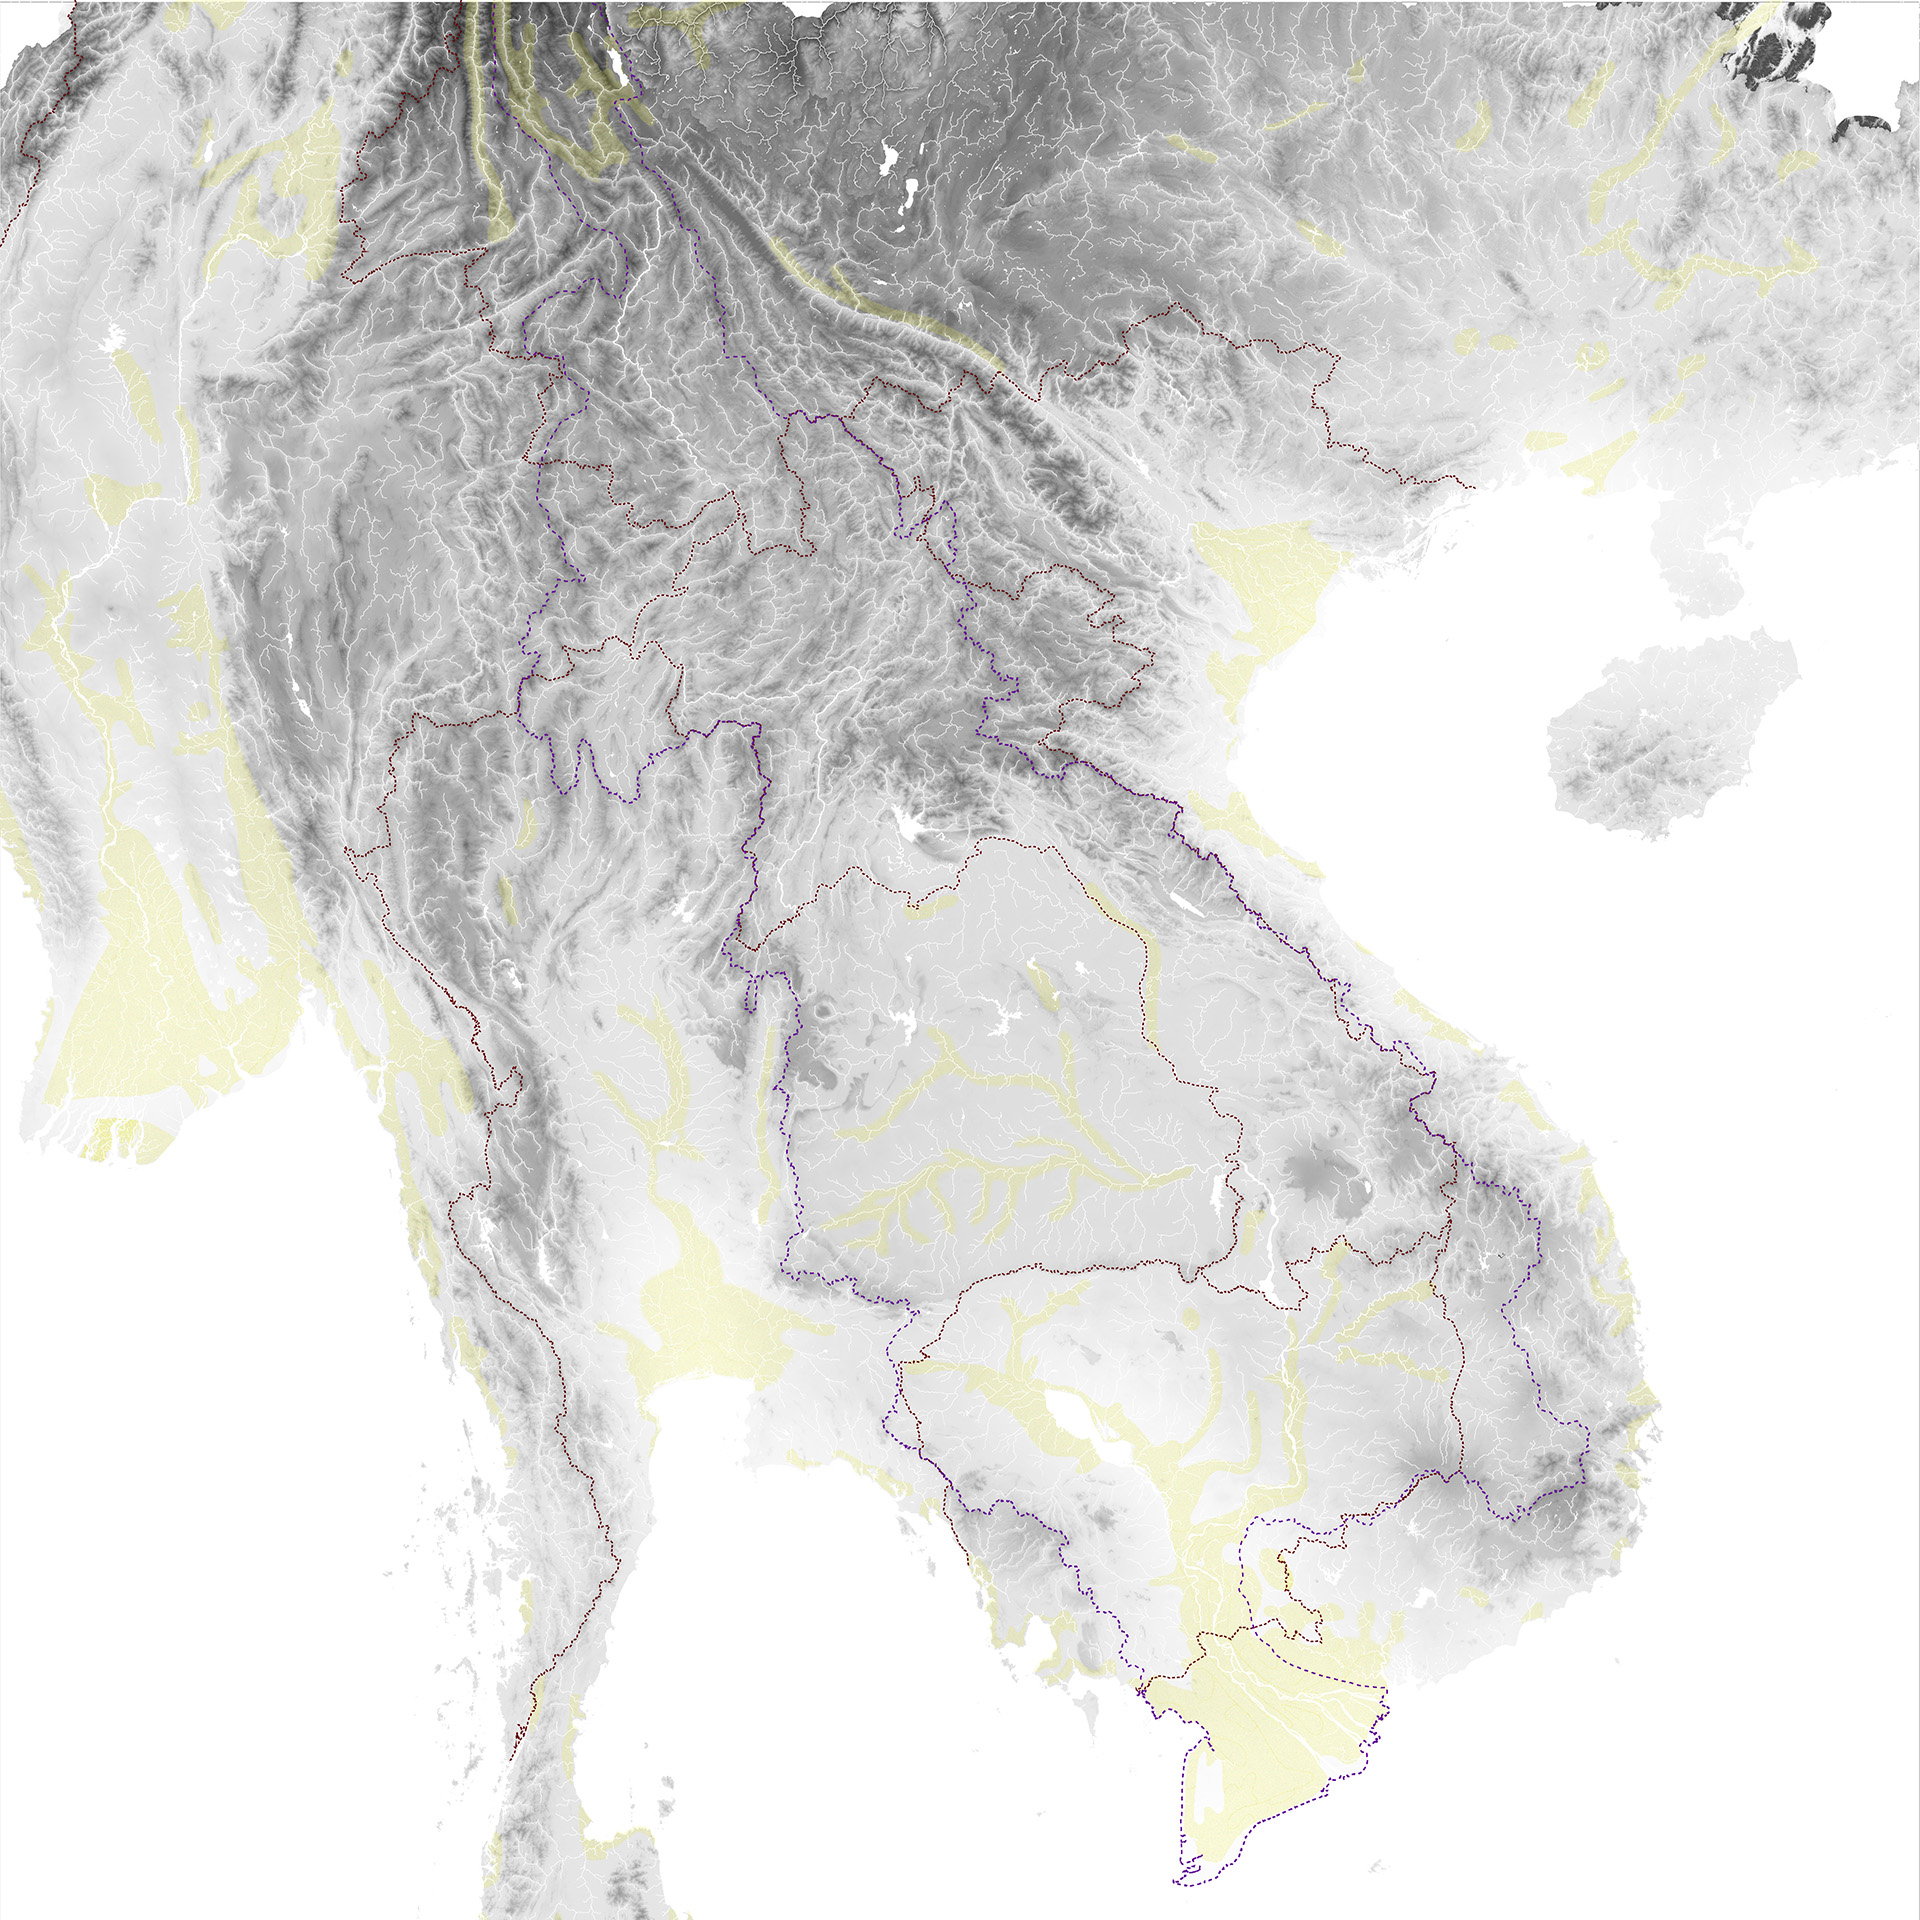
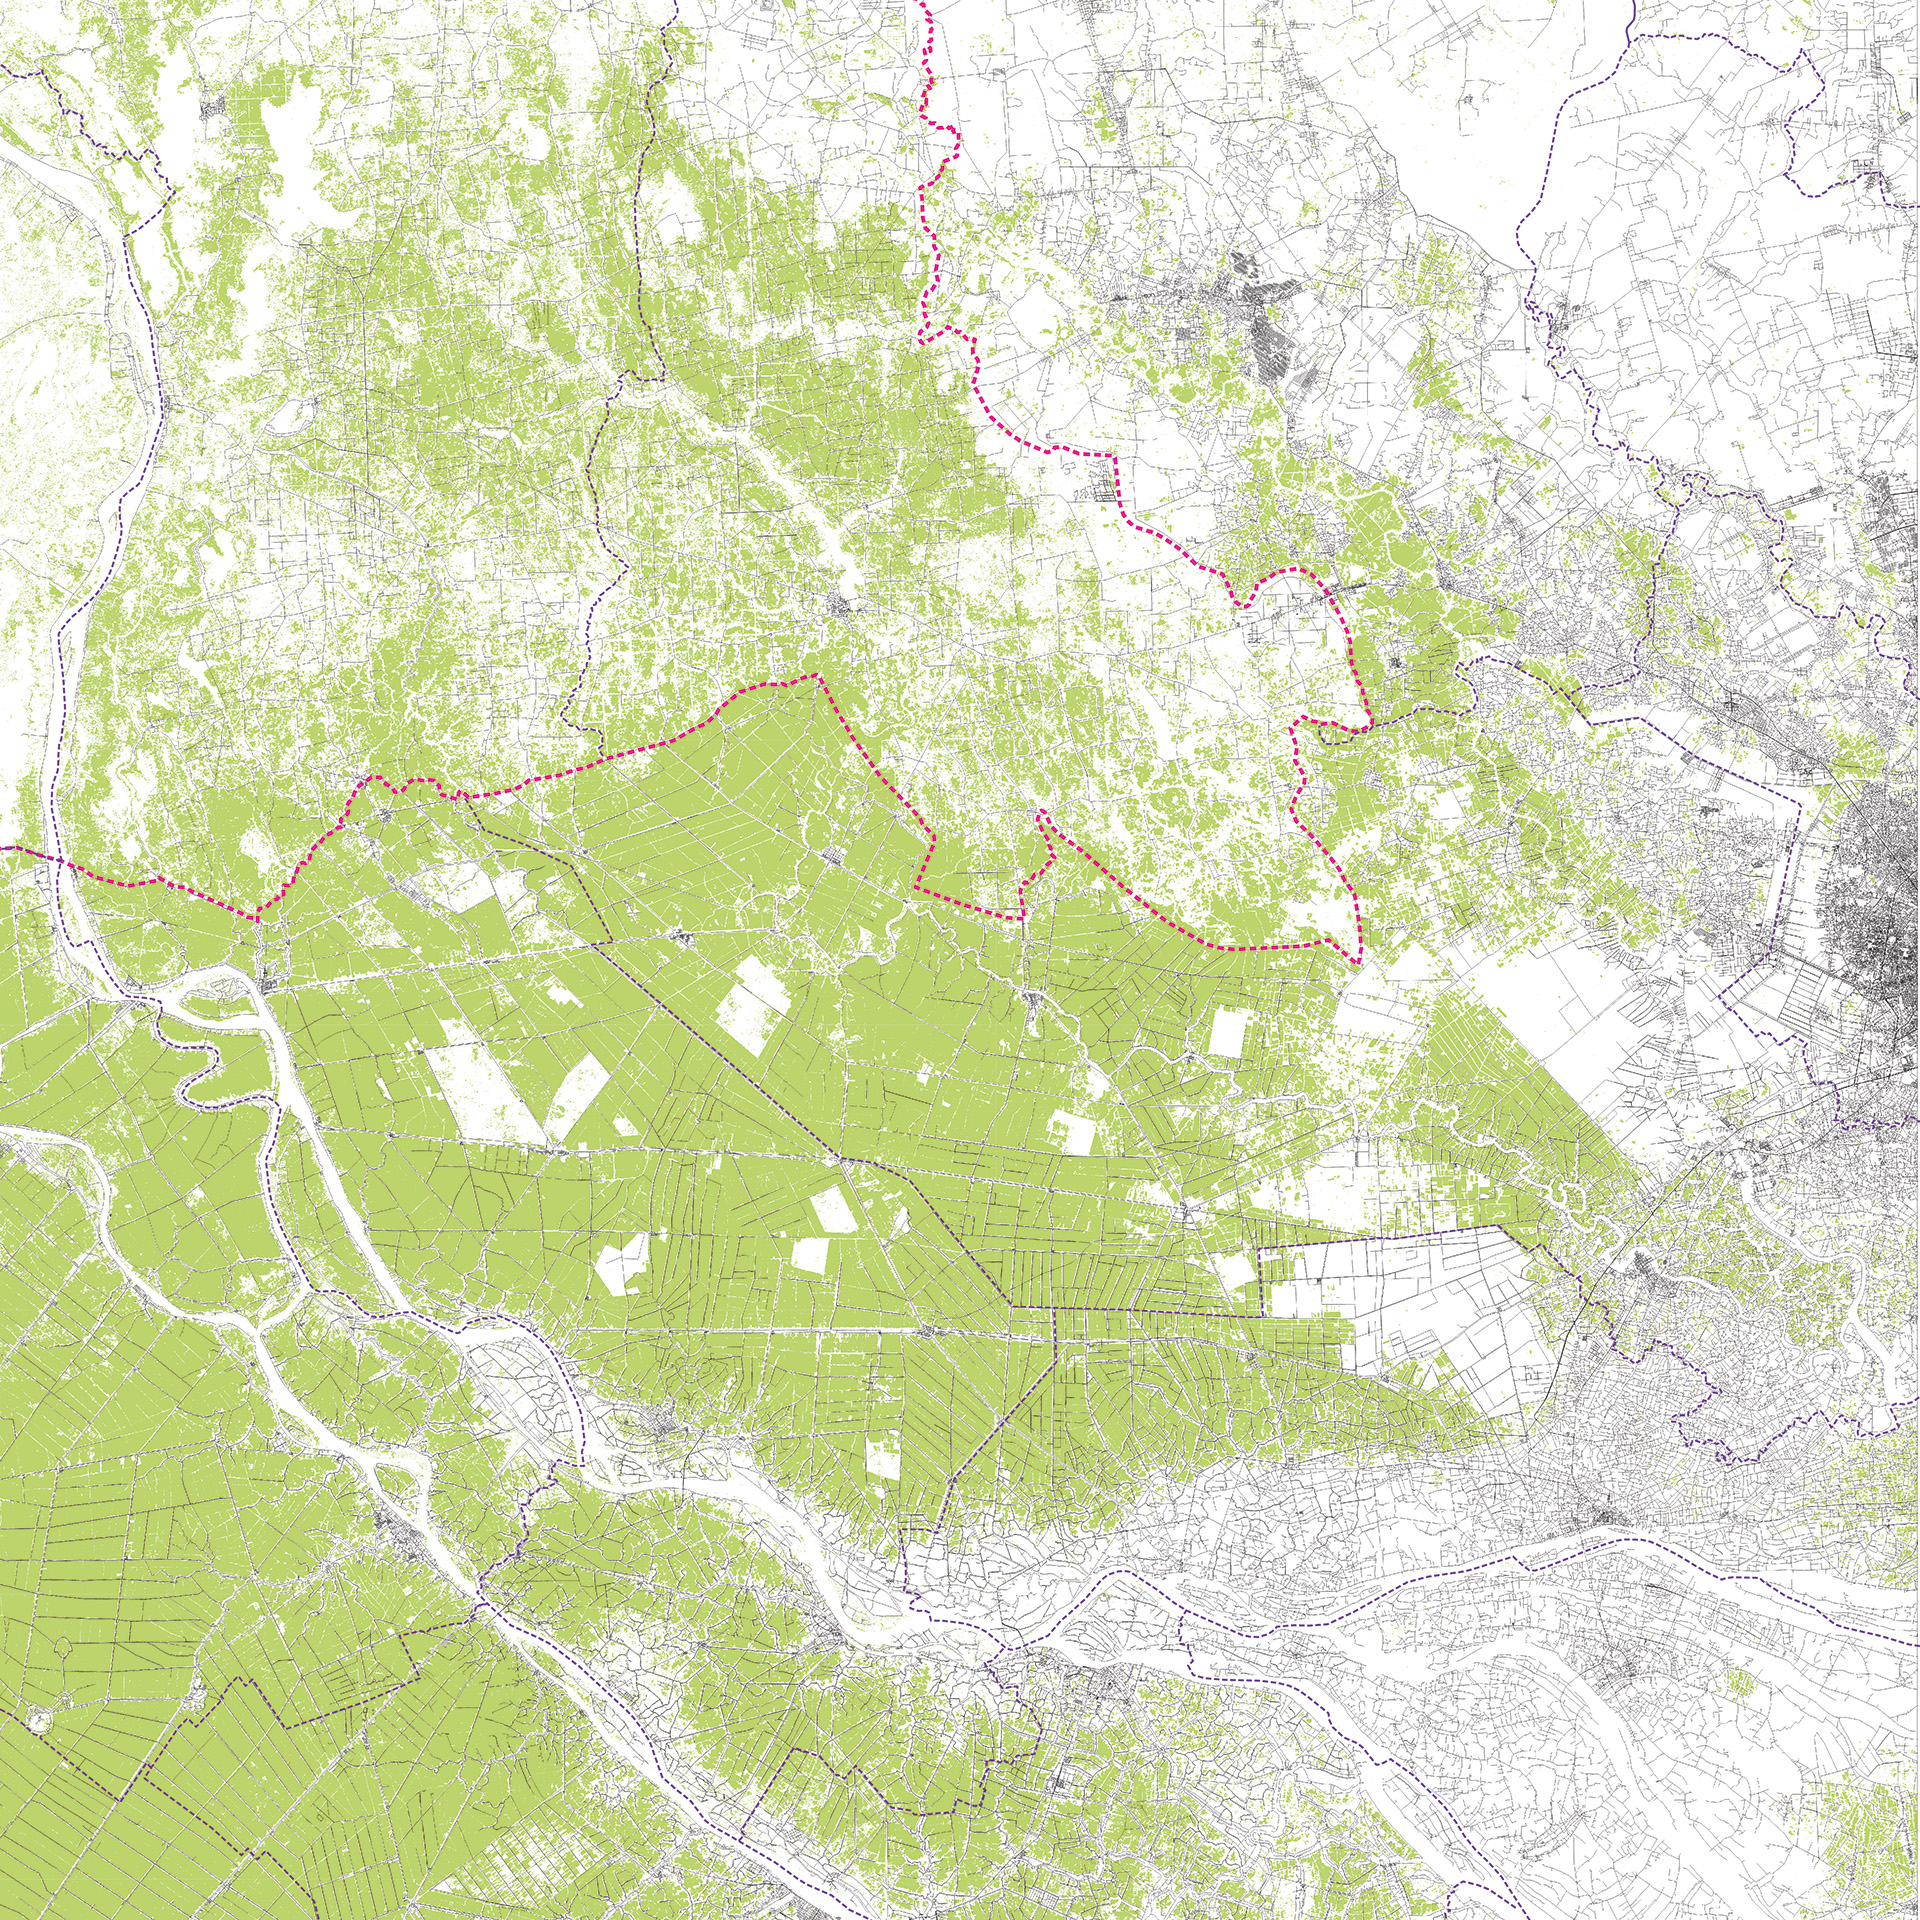
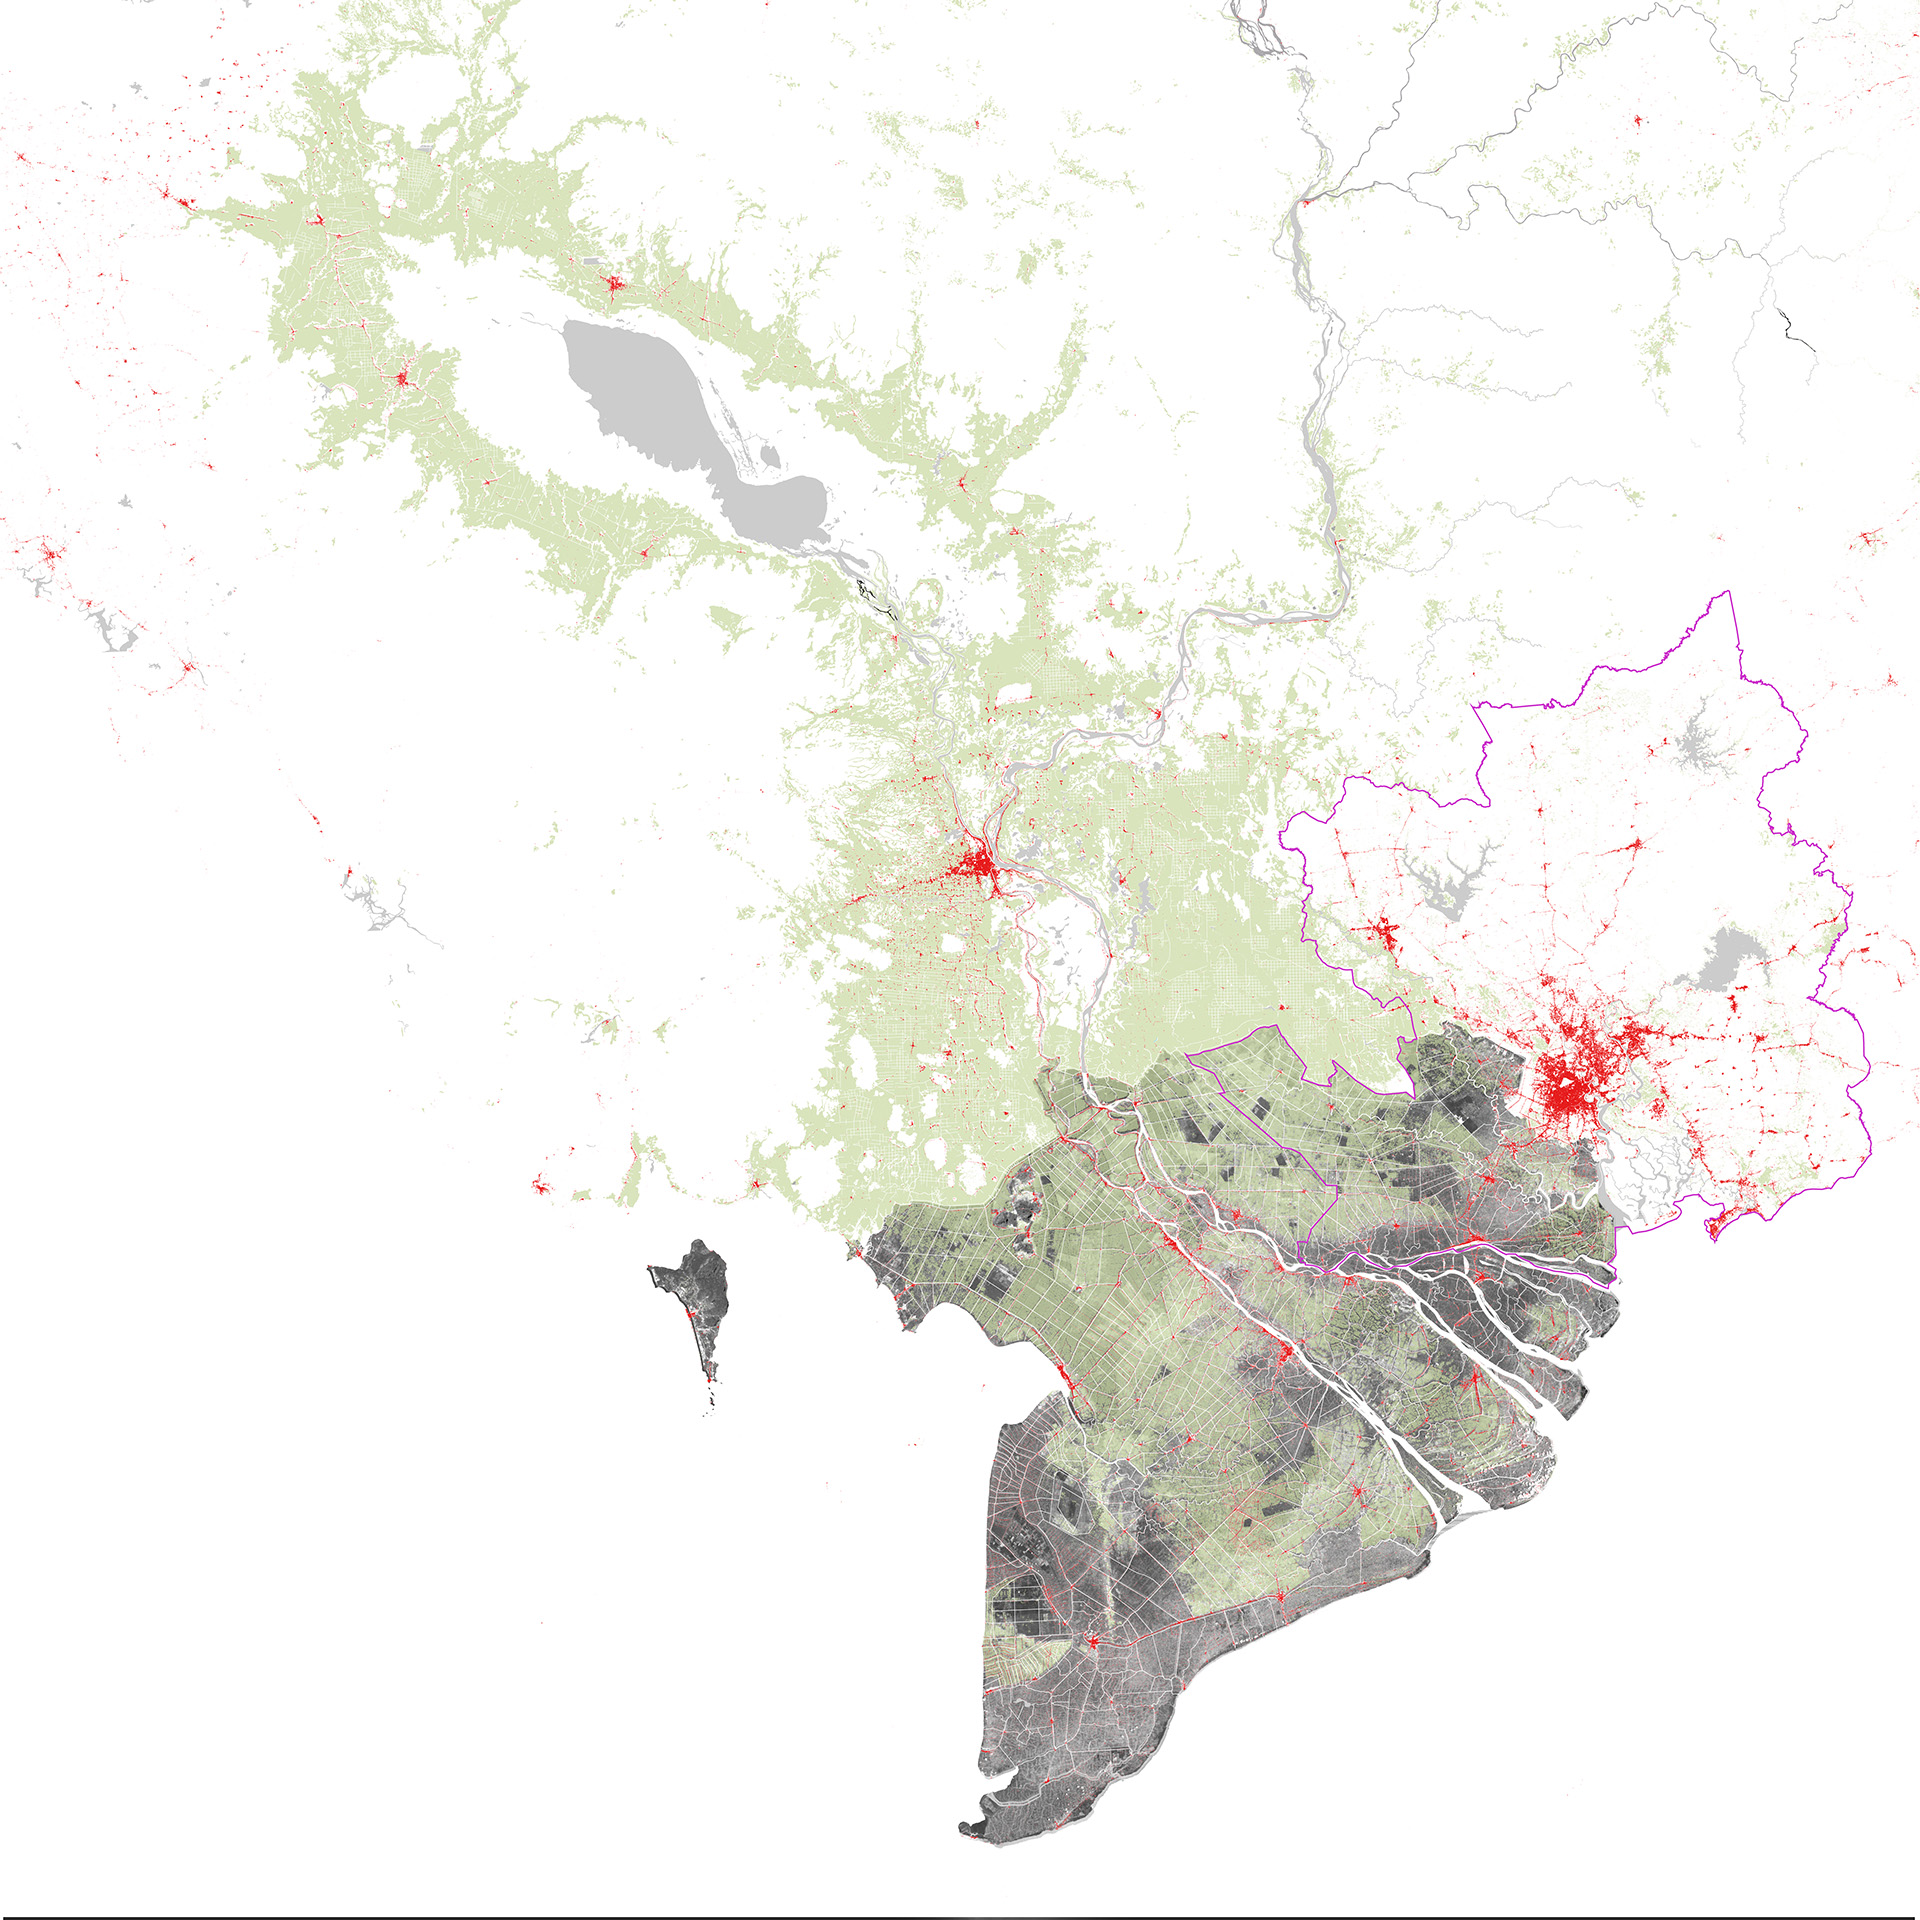
The Mekong Delta is, on the one hand, a wetland and densely populated area stretching across Cambodia and Vietnam. On the other hand, it is a collection of maps, representing a very diverse landscape. The two are not identical, notes Chris Romanos in his doctoral research. “The most important lesson from my research is that you have to validate a map. Otherwise, it's better not to use it.”
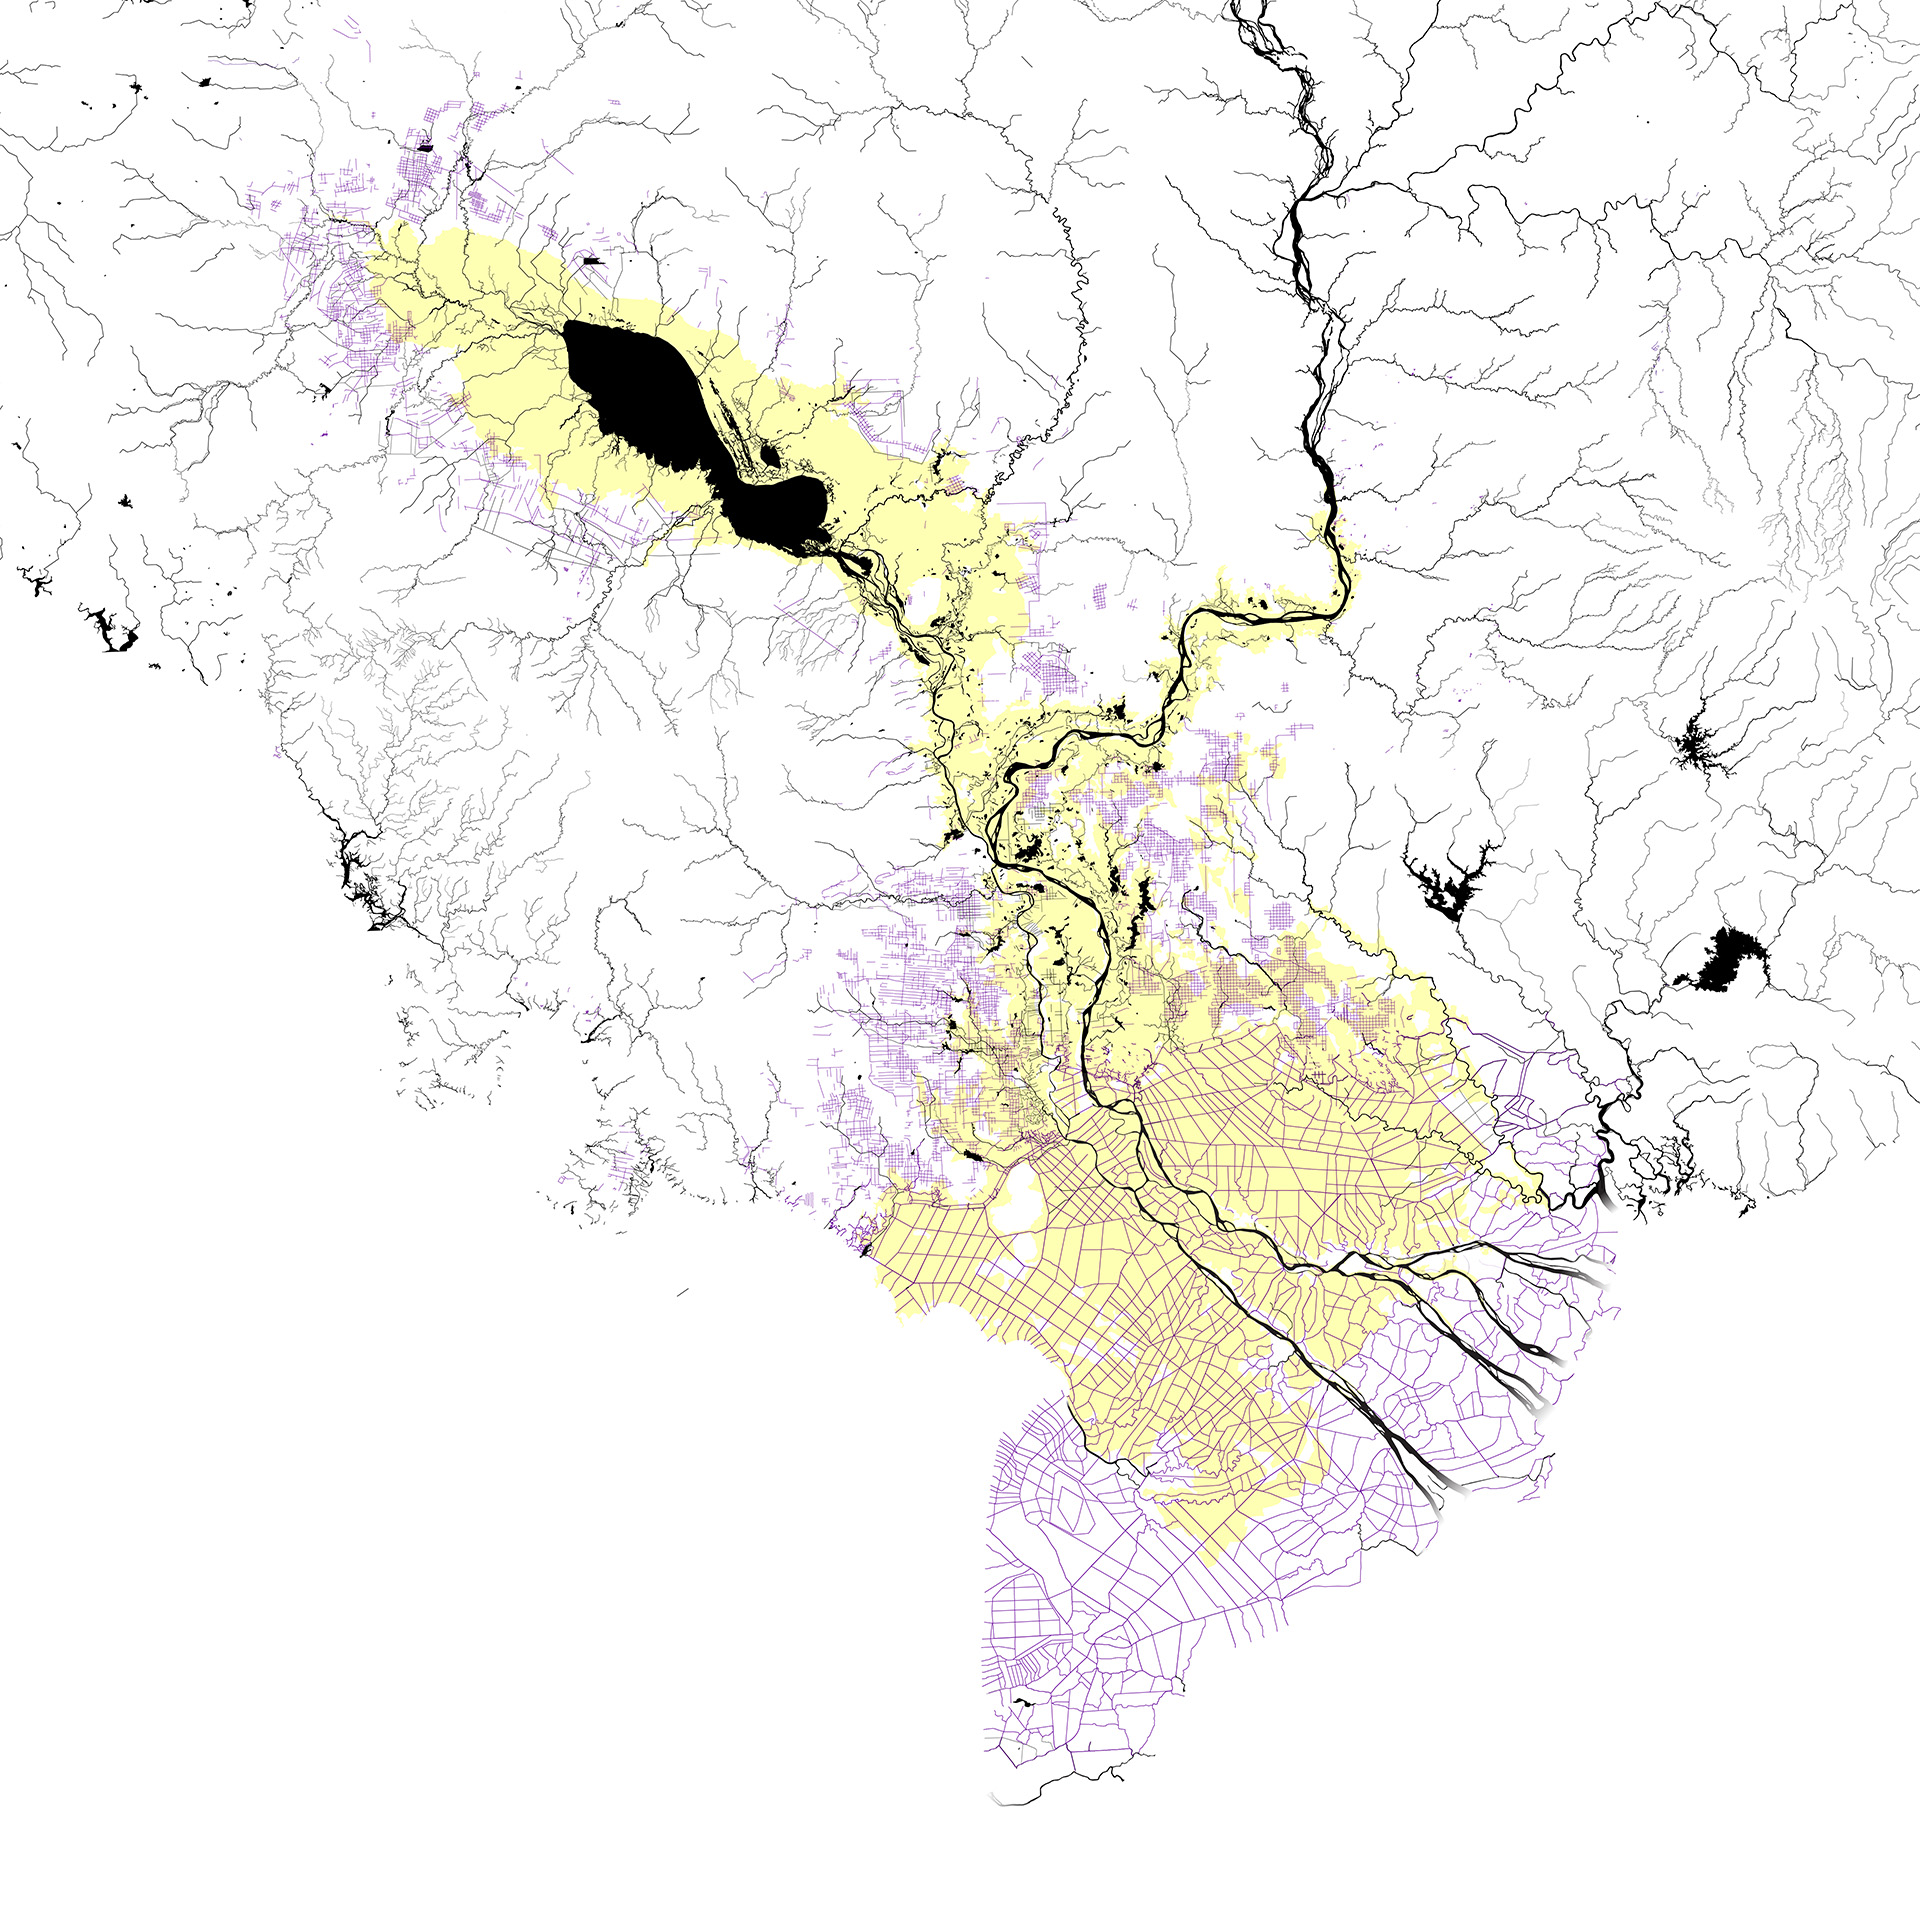
A look at a map of the border region between Vietnam and Cambodia can yield all sorts of surprises. For example, man-made waterways are colored purple on most maps, while naturally formed rivers and other bodies of water are black. There are also maps showing triangles here and there. Temples? Villages? No, they are the camps that American commandos, of the so-called Delta Force, used as bases of operations during the Vietnam War. Nowadays, they are nowhere to be found anymore.
In the same map a grid of canals is visible that the Khmer Rouge had constructed during their reign of terror. Officially as an irrigation system, but hydraulically it does not function. ‘The map contains lies,’ says Chris Romanos. ‘The problem is that we can only fully oversee the total system of a delta in the form of these kinds of maps. That's what we base decisions about its spatial design on.’
Planning exploration
The research of Romanos, who spent a long time as a designer in the Far East, began as a planning exploration. How did the existing spatial layout come about and what sort of new developments would fit in it? The research turned out to be less straightforward than thought. Due in part to the corona epidemic, he could not go to the area. That’s why the focus came to be on source research. In doing so, he came across numerous maps, made in various eras and from various backgrounds. These turned out to contain major differences. It is commonly thought that water – whether or not diverted by dams, reservoirs and irrigation canals – is the all-important factor in the spatial development of a delta. Yet that is certainly not always the case. ‘People – not the water – usually shape the space,’ Romanos says.
Other natural barriers, such as mountain ranges, can also play a role in shaping the map. As can ethnical differences. Boundaries defined by these have a more political character and can sometimes clash with natural boundaries.
Different maps, different information
Power relations also changed the face of the area over the centuries. The interests of indigenous rulers centuries ago were not identical to those of twentieth-century European colonialists, such as France and Britain. ‘The question that came to mind was: how does it all coincide?’ says Romanos. ‘One thing was soon clear: You can't simply superimpose the different maps on top of each other. For that, the differences and the number of errors is too great.’
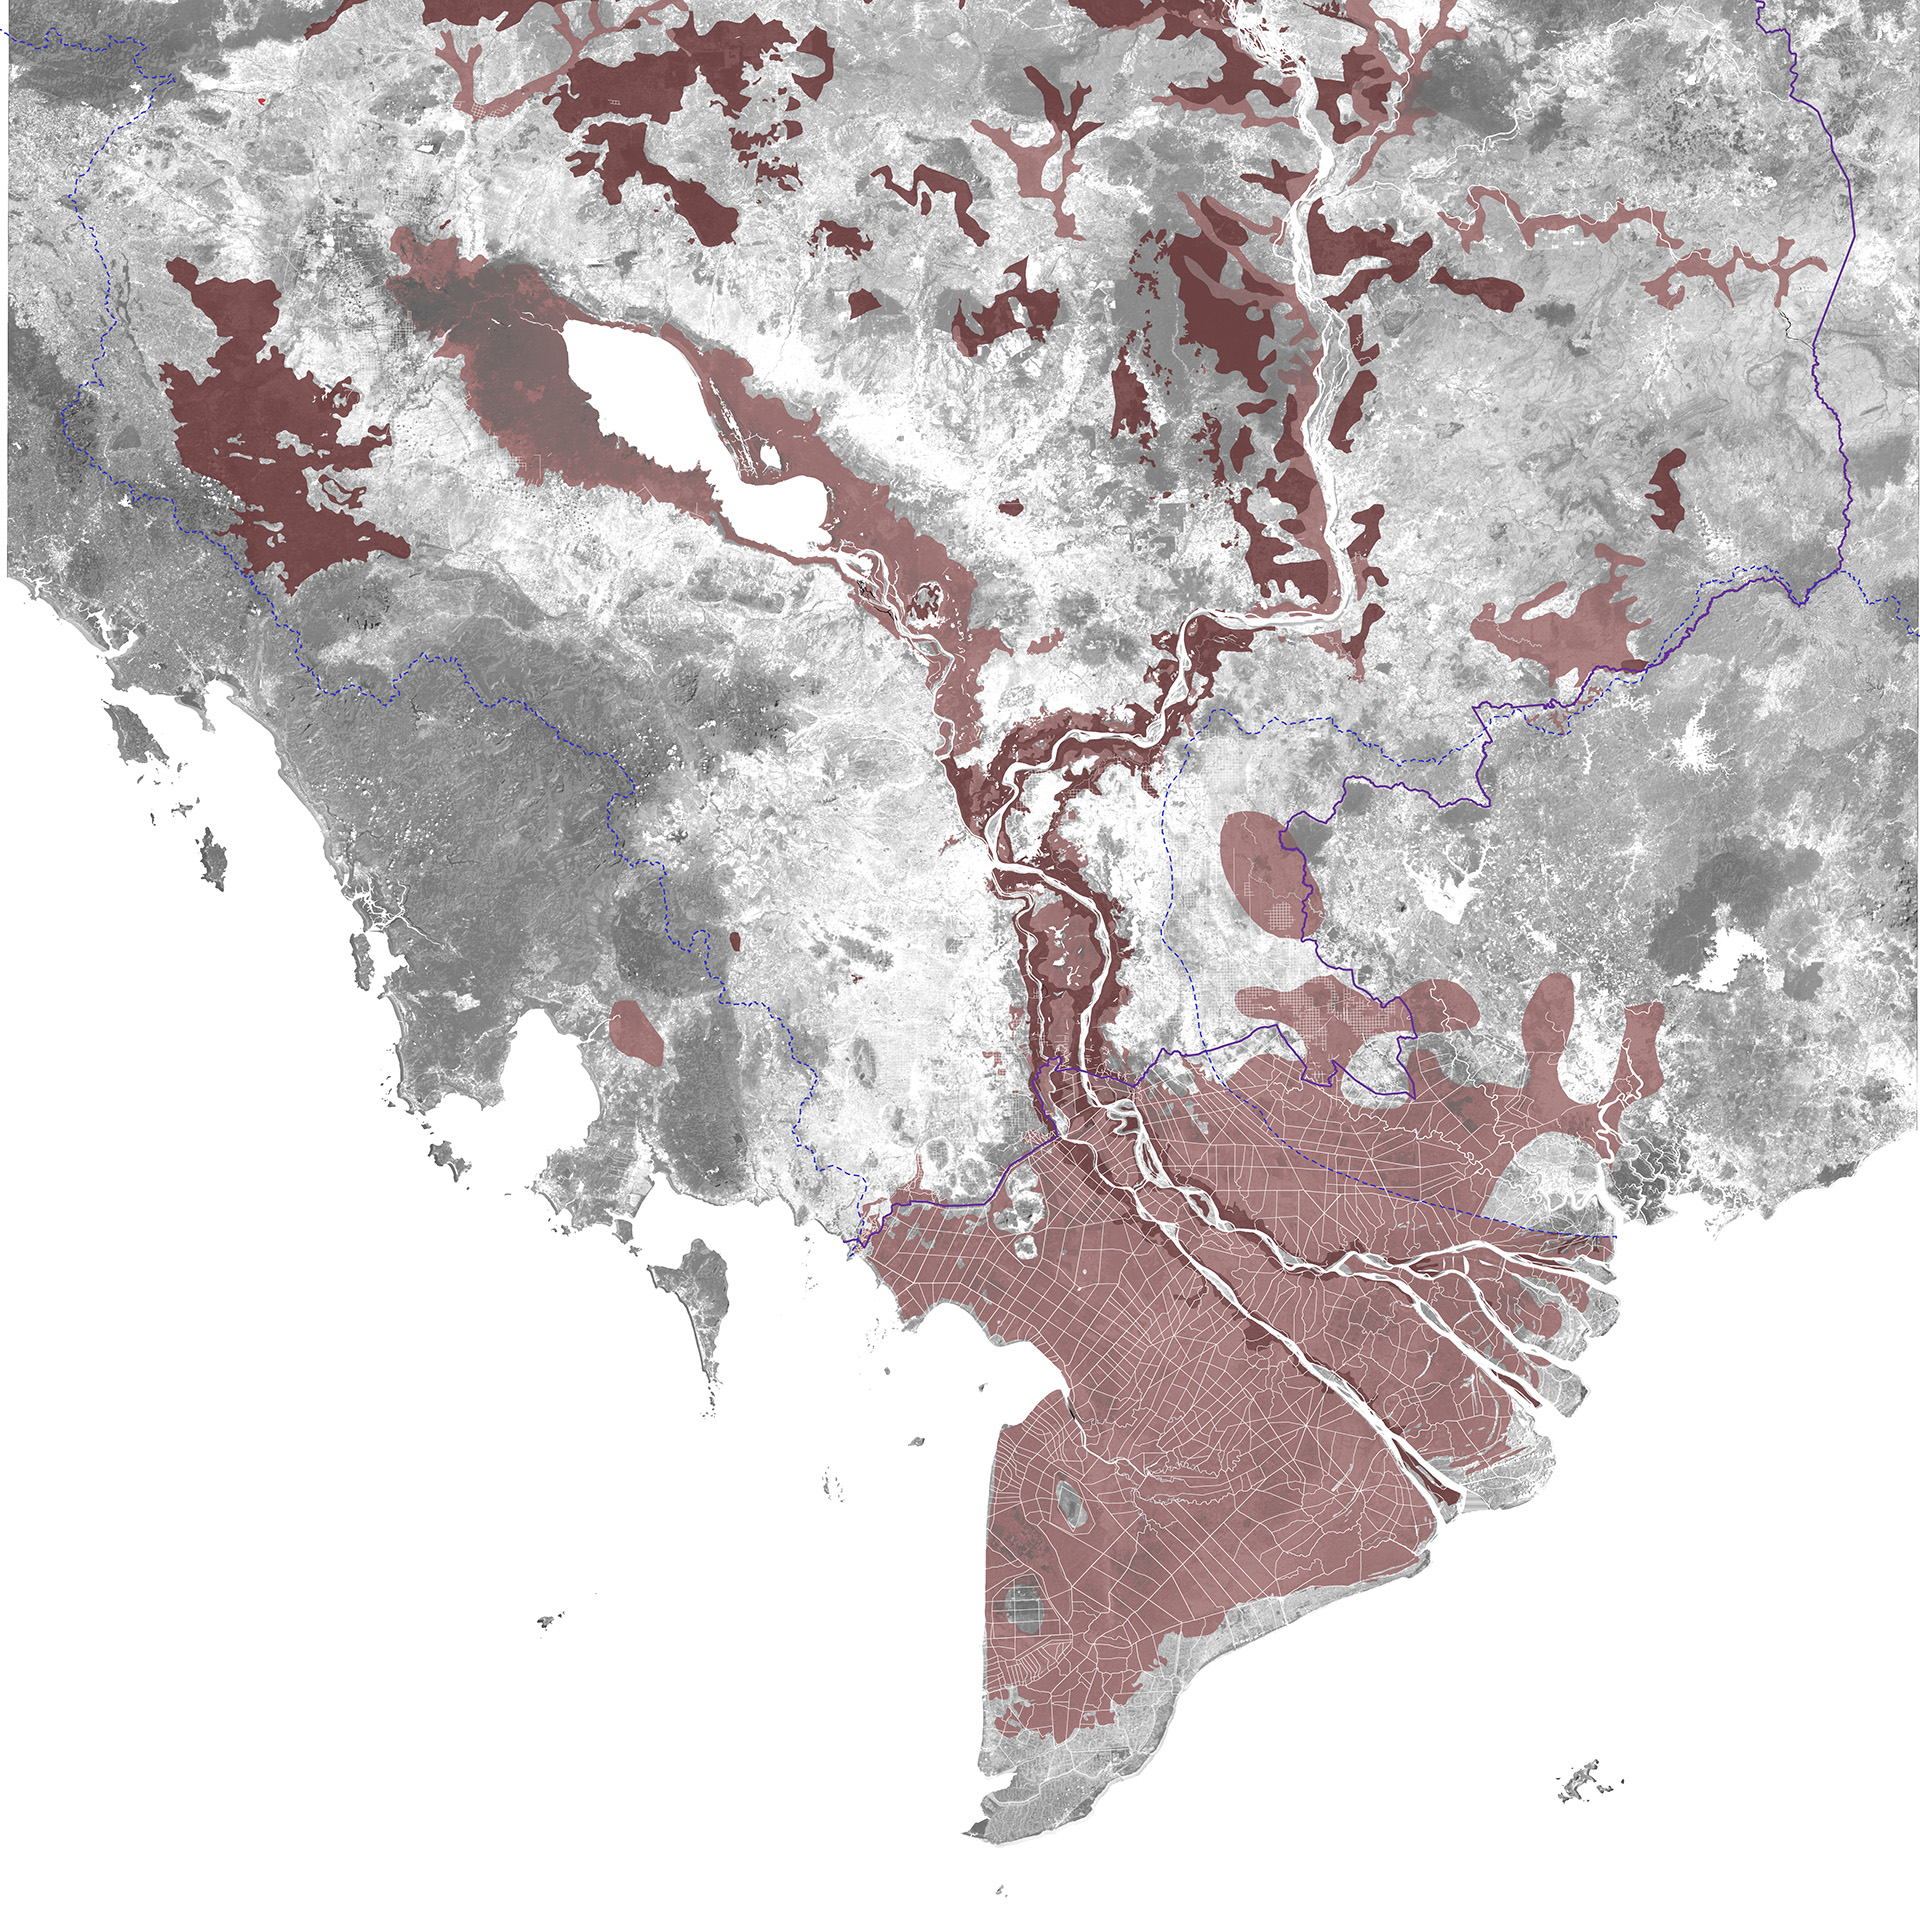
Even recently produced maps showing soil composition show substantial differences. That can have far-reaching consequences. Such map data can determine whether a piece of land will be used to grow rice or to build houses or infrastructure. The user can also use the map data to apply for financing at the bank. Problem is: the data on the map is far from always correct. If the soil on one map is clay and on the other is sand, one of the two is wrong. ‘We make what we see on the map into reality, but it's not,’ Romanos says. ‘That's why the most important lesson from my research is that you have to validate a map. Otherwise, it's better not to use it.’
More information
Chris Romanos received his doctorate on 3 April with his dissertation ‘Liquid Territories: Configurations of geographic space in the cartographic projections’. His thesis is available here.


