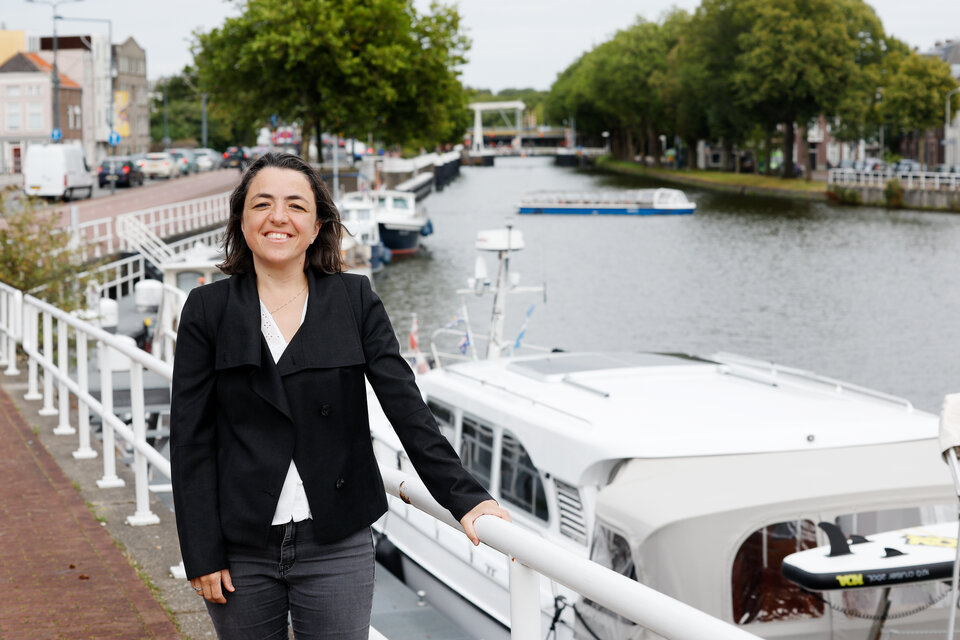
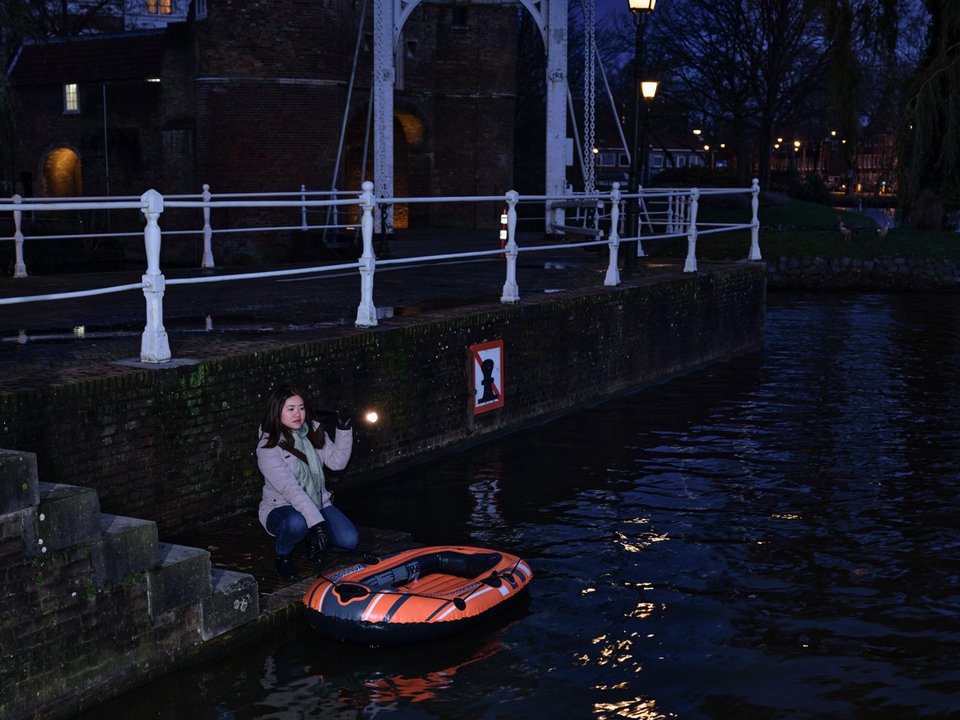
Delivery vans with logos in colours ranging from purple to red cruise along the same narrow cobbled street. There is plenty of unused space in those vans and there are many alternatives to those streets, such as the adjacent canal, which was once used to transport goods. ‘We can do much better than this,’ associate professor Bilge Atasoy keeps thinking as she walks through the city.
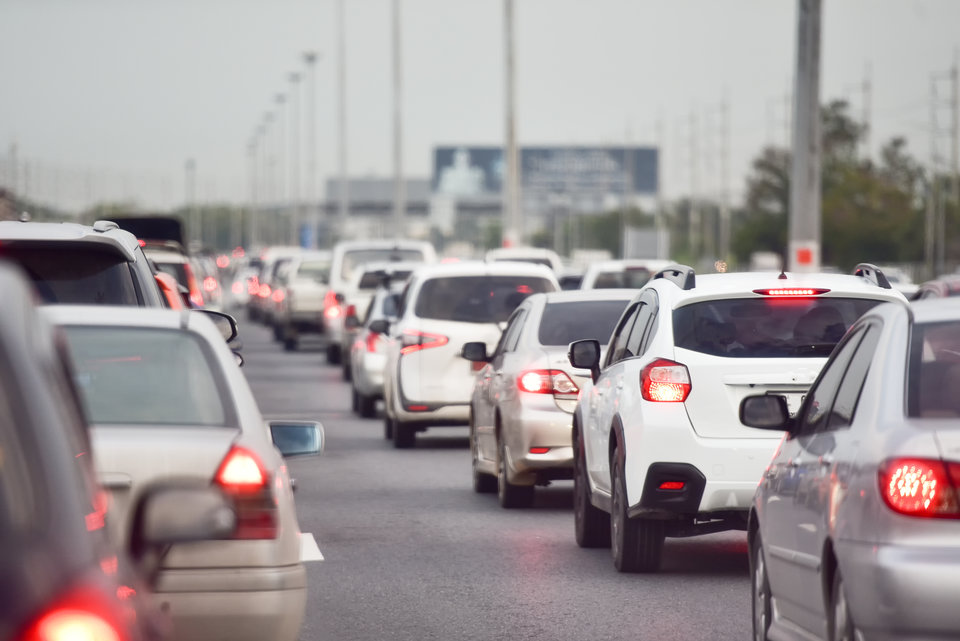
We still don’t have a way of optimally coordinating transport systems. ‘The vans that deliver all the stuff we order online don’t coordinate deliveries with each other,’ says Atasoy. Using mathematical models of road, water, and rail networks, Atasoy is investigating how to achieve the greatest gains in usability, capacity, time and cost. Indeed, her aim is to make the transport of goods more efficient, sustainable and user-centric. ‘I believe we can make much better use of what we have by coordinating the various components of the transport system differently,’ says Atasoy.
By road and water
Atasoy is amazed at the way goods are transported in Europe. ‘Most goods are transported by truck, even though there are plenty of waterways available.’ For example, from the port of Rotterdam to Germany, but also within cities. ‘We have underused alternatives which could avoid traffic jams and long distances travelled.’ Moreover, the roads in the cities along the historic canals are not designed to carry so much weight.
Atasoy creates logistics models on a European scale as well as for cities. For the municipality of Amsterdam, her research group created a model that included waterways for transporting catering goods. It showed that the number of kilometres travelled by road could be reduced by 70%. This was replaced by a specific number of kilometres travelled by water, but overall, it was lower. ‘If we look at the number of kilometres travelled on both road and water, it was 25% to 30% lower.’ She shows how they arrived at this result on her laptop.
Delivering soda and snacks by canal
Orange dots appear on a map of Amsterdam. If you transport goods by water, they have to be transferred onto land somewhere. ‘Not all restaurants and hotels are situated right on the water, says Atasoy. The dots are potential transfer and storage locations for drinks and food that can be reached from the water. These locations are key to using the waterways effectively. From here, goods can be transported the last few kilometres by roll containers, electric cargo bikes or small electric vans.
Green lines shoot out from the orange dots. These lines represent the number of trips needed to transport the soda and snacks, and the number of kilometres travelled per vehicle. The more orange dots appear on the map, the fewer green lines shoot out from a dot. ‘For example, if you choose 15 transfer sites in the city center that are open eight hours a day, you need 9 ships,’ says Atasoy. ‘We can calculate numbers like that for different cases.’ By running through all the possibilities, the model finds the scenario where vessels and vans together travel the fewest kilometres.
Dynamic models
Transfer locations are decisions that a city makes for the long term. There are also logistical decisions that cities or companies may want to make dynamically. For example, avoiding a route during an event or using the same location for multiple purposes. ‘You could use a site for the temporary storage of goods from six to eight, for instance, and then, when people start working, for parking,’ says Atasoy. ‘For short-term changes, we have models that re-optimise based on the latest known information.’
The use of waterways in flexible logistics planning is still a challenge. Modes of transport by land and water must be well coordinated: vessels are always dependent on the last leg of the journey, which must be completed over land. Atasoy is convinced that there is a solution for this. ‘With good models, we can make the transport system more reliable and thus minimise the risk of disruption.’ New technologies are also helping to make the system more robust. ‘Autonomous vehicles and vessels could enable a seamless coordination to mitigate such risks and take actions based on shared real-time information.’
The city through a logistics lens
Even then, we’re not there yet. Atasoy is looking at more than just miles and scheduling. ‘You don’t want the distribution points to make the city ugly or inconvenient for the residents.’ She starts with a generic model that can be used more broadly in other cities, for example. Then she adds more and more information specific to a particular city. For example, unsuitable locations for distribution points, such as Dam Square or Leidseplein.
To add real-life information to a model, she talks to experts. She also visits locations with students to observe situations first-hand. ‘I enjoy teaching students how to go from a city to a logistics model,’ she says.
Coffee break
A logistics model must also accommodate the needs of users, which can be unpredictable. Take a project with water taxis in Rotterdam. Atasoy analysed whether the skippers earned more by continuing to cruise around in search of new passengers or by staying in one spot and waiting. ‘It struck me that the water taxis kept going to a specific place, which didn’t make any sense. Why there?’ Atasoy wondered. New passengers were seldom picked up there, so it didn’t benefit the water taxi company at all.
As it turned out, it was a hotspot on the water where skippers could moor their boats for a coffee,’ she says with a laugh. ‘We can optimise everything, but skippers enjoy their work more when they can make their own choices too.’ Then you adapt the model. ‘Sometimes you have to compromise a little on time or profit,’ she says.
From a multi-functional square to skippers who want coffee: Atasoy always sees opportunities. This is not limited to her work. ‘I suggested to my neighbours that we share gardening tools. After all, it’s a waste if we all buy the same thing,’ she says, with a chuckle. ‘I can’t stand it when things are lying around unused.’

