This year we are building on last year. After adding extra weather stations and soil sensors, we will further densify our measuring network this year with a few extra weather stations and groundwater measurements! Although the changing climate certainly causes different rainfall patterns, measuring climate is not only about rainfall, but also about local temperature, temperature differences, soil moisture and evaporation of water from the soil and plants.
We don’t have weatherstations to distribute anymore, but you can still register until August to participate in the groundwater measurements (via waterlab-sc@tudelft.nl).
Like to stay informed? Send an email to waterlab-sc@tudelft.nl to register for the Delft Meet newsletter!
-
Results 2023
In 2023, masters student Marchien Boonstra conducted extensive research on how to improve the data quality of our weather stations. They examined how incorrect installation of the weather station (e.g., tilted, under a tree, or against a fence) influences the measurements. They also explored how we can statistically identify and (partially) correct these deviations in the dataset. You can read their report here.
For a summary of the results, have a look at this infographic (Dutch).
In addition, on May 31 we gave a presentation about the results for 2023 and a preview of Rick Verkooij's research into our groundwater measuring points. The slides of the presentation (in Dutch) can be found here.
-
Results 2022
On December 12th 2022, a webinar was organized to reflect on the results of this year, the progress of the groundwater pilot, the results of the evaluation project from last year, and most importantly: our plans for DMR in 2023 and beyond.
You can find the presentations by Dr. Marie Claire ten Veldhuis, Prof. Remko Uijlenhoet, Sipke Bakker, and Jordy Janssen behind the links (note for Lonneke: same links as currently provided). The report on Jordy's research into the experiences of citizen scientists with Delft Meet can be found here.
In the spring of 2022, Sonny Harnam conducted the data analysis of the entire dataset from 2021. He compared the DMR data with the radar data from the KNMI. You can read the full research report here.
-
Results 2021
In 2021, 105 residents of Delft have collected 5128 data points in 3 months (1 Aug to 31 Oct)! The data up to and including 17 September have been analysed by two TU Delft students, Karen Chen and Rafaël van Beek. The results are already promising and a summary can be found in this infographic. In addition, we organized a webinar on November 24. The presentations given by Karen and Rafaël can be found here: Karen and Rafael.
All data points can be found on our data map.
The radar data from the KNMI In the spring of 2022, Sonny Harnam analysed the full 2021 data set. He compared the DMR data with. The infographic with the summary of the results is still in development, but you can read the full research report here.
-
Results 2020
Between July and September of 2020, we received 1991 measurements from 95 participants. These data were subsequently analysed by TU Delft student Illias Timori, guided by principal investigator Marie-Claire ten Veldhuis. The results are promising! Not only did we receive a lot of data, but most of the data is as reliable as the official KNMI (Royal Dutch Meteorological Institute) data. Because the KNMI has a lot less rain gauges per square kilometer, Delft Measures Rain provides a higher resolution of rain measurements within Delft. That is exactly what we were looking for! You can find an overview of the most important results in the infographic. All data can be found on our data map.
Do you need some inspiration or support to make your garden greener, insect-friendly or climate proof? Have a look at www.klimaatmaatdelft.nl (Dutch)
Delft measures Rain 2020
Variability in rainfall across the city
Remko Uijlenhoet, Arjan Drost and Marie Claire ten Veldhuis conduct research at TU Delft into how cities influence local rainfall and temperatures. Within the city, it can vary per neighbourhood how much it rains, despite the relatively small distance between the neighbourhoods. Also, not every neighbourhood is equally green and, especially in the summer, the temperature can vary considerably from neighbourhood to neighbourhood. Due to climate change, those rain and heat patterns are also changing. That is why we also measure the local temperature and soil moisture to see whether the amount of greenery in the area affects how hot it is in the summer and how moist the soil remains.
The KNMI has an average of 1 weather station per 100 square kilometres throughout the Netherlands, in total there are about 300 of them throughout the country. Apps, such as Buienradar, measure rain per 1 square kilometre, but because the radar measures the rain in an indirect way, it is often inaccurate. During the Delft Measure Rain project, we are trying to increase the number of weather stations, so that we measure rain on every square kilometre in Delft.

Remko Uijlenhoet

Arjan Drost
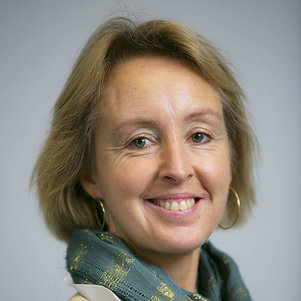
Marie-Claire ten Veldhuis
Who and where?
During Delft Measures Rain, we try to increase the number of rain gauges, so that we can do a daily measurement for every km2 of Delft. We aim to do at least 1 measurement per km2 of the city for the duration of 3 months. To do this, we use manual rain gauges and sensors that will be connected to the WOW-KNMI network of local weather stations.
