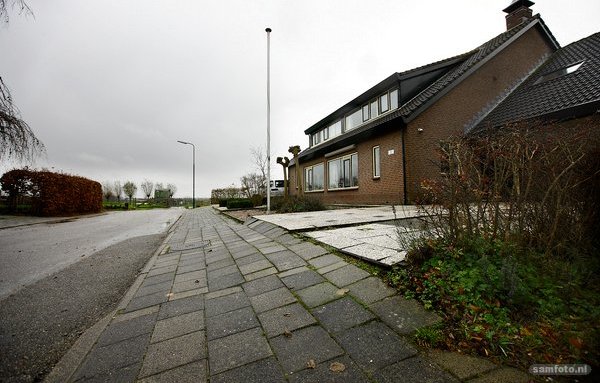
Subsidence in the Netherlands
Researchers headed by Prof. Ramon Hanssen (CEG) have developed an interactive map showing subsidence in the Netherlands.
The scientists incorporated three different types of measurement data into the underlying model: satellite radars, GPS and gravity measurements.
The map shows the different types of soil in the Netherlands and the location of oil and gas fields. This makes it easy to see the causes of the subsidence observed.
The map is kept up-to-date using the latest satellite data released on a daily basis, so we can see whether subsidence decreases if less gas is extracted in Groningen.
The map has enabled researchers to distinguish between the deep causes of subsidence, such as gas extraction, and the effects in the uppermost few metres. Until now, it was not possible to directly measure this top layer. It turns out that this ‘shallow’ subsidence is even greater in some places in the Netherlands than the more familiar, deep causes. This subsidence is particularly measurable in the peat and clay areas in the western Netherlands. Climate change appears to play a major role in this accelerated subsidence. The relatively warm summers cause more dehydration of the peat soils, speeding up subsidence. This process is irreversible: the peat oxidises, which also means that more CO₂ is released into the atmosphere.
