Air quality between Delft and Overschie
Fluid experts from TU Delft have created a model to determine how air pollution spreads from the A13 through the adjacent Overschie area. The DisTUrbE (dispersion in the turbulent urban environment) project tests the effectiveness of measures designed to combat air pollution.
‘Satellite images show that the Ruhr area, the mouth of the river Rhine and IJmuiden have the highest levels of NOx in Europe’, says Professor Jerry Westerweel, Head of the Environmental Fluid Mechanics (EFM) section in the Faculty of ME. ‘I live at the heart of one of these polluted areas. Models for the spread of pollution are available at a scale of 1,000 metres and upwards. We wanted to zoom in on the source, but the models between 10 and 1,000 metres are substandard. We have now simplified things’. The team examined the section of the A13 between Delft and Rotterdam that is separated from the adjacent residential area by a perspex screen. Would such a screen help?
“They know that it’s better to take it easy during the evening rush hour to avoid coughing fits”
People living in Overschie know that they often have to clean the window frames to keep them from turning grey. And that it is better to take it easy during the evening rush hour to avoid coughing fits. They also think that they are less affected by the motorway behind their house than in front.
The EFM section took an experimental and theoretical approach to the spreading issue. Doctoral candidate Jerke Eisma conducted measurements in the lab’s water tunnel. A scale model of part of the neighbourhood was mounted on a disc the size of an LP. A 30-centimetre-deep layer of water flowed over the model, representing the atmosphere. Eisme rotated the disc to simulate different wind directions. A flow of water offers benefits in terms of being calmer (it has a lower Reynolds number), which makes it easier to control conditions.
Jasper Tomas, another doctoral candidate, used the DALES model (Dutch Atmospheric Large Eddy Simulation) to calculate the spread of exhaust fumes over the neighbourhood. DALES calculates the air flow in a ‘box’ of air several kilometres across the ground and at an altitude of two kilometres. A third doctoral candidate, Manu Goudar Vishwanathappa, provided the theoretical basis for the applied numerical simplifications.

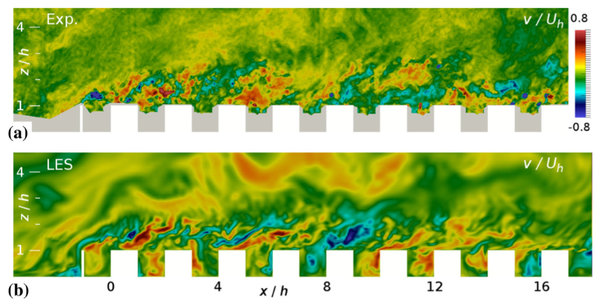
Experiment (above) and simulation of the spreading of pollution match. The wind comes from the left, the white boxes are the blocks of houses behind the screen.
A cursory glance shows that the results of the water tunnel experiment (Exp.) correspond with the simulation (LES). The colours indicate vertical air movement. Noteworthy is the fact that the air mixes a lot more readily after passing the dividing screen than the air flowing from the left. The air rises shortly before the screen (light blue), while polluted air flows downwards on the far side of the houses (the white blocks). The intuitive notion that the effects of particulates would be less at the far side is therefore incorrect. The project will now continue along two paths. Researchers want to use a simplified flow model that requires fewer calculations to demonstrate the most relevant aspects of the spread of particulates. They also want to use a combined approach of simulations and experiments to test and improve various measures to combat particulates. Vegetation, for example, or deflecting particulates using electrically charged grids. But what is the ideal size? And why would a particular tree or grid be better at removing particulates than another? For those living in Overschie and comparable neighbourhoods, this will undoubtedly be a relief.
