River Basins
A river basin is a hydrological unit. All precipitation falling in this area will remain in the basin or will end up in the same river, going to the sea, if it does not evaporate. Alternative names for the some object are catchment or watershed. River basins are generally separated from each other by natural division lines along the highest points in an area. Groundwater may cross topographic boundaries, complicating the concept somewhat.
From a hydrological point of view a river basin is the most logical unit to study hydrological processes and the water balance. The World Wildlife Fund has developed Hydrosheds, a tool to outline most watersheds on Earth.
From a management point of view the river basin is also an important system. For example: extracting water from one part of the basin will influence the availability of water in other parts and water polluted upstream will flow downstream and may influence the health of people downstream. The unit of analysis for integrated water resource management will therefore also be the river basin.
In practice, management units in many cases do not correspond with river basin units. Some 260 rivers around the world are located in more than one country. In many cases a river flows constitutes a border between countries or other administrative units. The different management units may have very different interests that may lead to conflicts.
The European Commission has drawn up a directive, the Water Framework Directive, requiring policy development and planning to be done at a river basin level. This means that water management in the whole area, with all the interconnections, needs to be considered in its entirety. It does not mean that daily water management practice will need to be managed at that level, but cooperation is needed. The picture above shows the different river basins in Europe.
Linear algebra and watershed logic
It would be very tedious to determine the river basin or watershed area by tracing every drainage pathway the outlet to the topographic boundary. Fortunately, we can use some neat trick from linear algebra and graph theory to efficiently determine the area that drains through any given point. If we divide an area into elements and assign to each element only the element into which it drains, we can readily derive global watershed properties from this local information. All watershed software is based on these principles.
A very simple example of six pixels is given to the right. Assume each circle is an area that all areas together fill (part of) a plane. Areas 1&2 drain into area 3, which drains into 5, etc. Such a system of nodes and links (or edges) is called a graph. This particular type of graph is called a "tree" because, well, it looks like a tree. We can develop an adjacency matrix, A, in which we enter a one in each cell (n,m) where area/node n drains into area/node m, and zeros where no connections exist. For our example, this would look like the matrix to the right.
One could say that the ones indicate which node n (row) is one step removed from node m (column). We could also make a matrix, A', that shows a one wherever two nodes are connected through two steps, and A'' for three steps:

Through inspection, one can quickly check that A'=A2 and A''=A3 . Remember that the product of two matrices, A×B, is formed by entering in each cell (n,m), the inproduct of the row n of A with and column m of B:
![]()
In general, A×B¹B×A, so we distinguish pre-multiplication and post-multiplication. (http://en.wikipedia.org/wiki/Matrix_multiplication).
The sum of these matrices, S=A+A2+A3 , would in each row show the "downstream" areas and in the columns all "upstream" areas. In the case of a watershed, we would also like to include a "zero-th" step, the unity matrix, I, because each area drains also itself. Clearly, node 3 in our example drains 1,2, and 3. If we add I, we obtain the "watershed" matrix, S+I:
So the water from node 1 flows through 1, 3,5 & 6. All nodes drain through node 6 or, in other words, form the watershed of 6. By summing the columns, we quickly find the watershed size (or drainage area) for each pixel: 1=>1, 2=>1, 3=>3, 4=>1, 5=>5, 6=>6. Interestingly, I+A+A2+...+An=(I-A)-1, which can easily be checked by pre-multiplying left and right with (I-A). This means that all we need to know is the adjacency matrix A and invert (I-A). In other words, we can derive the complete structure of the watershed by just looking at the local drainage directions.
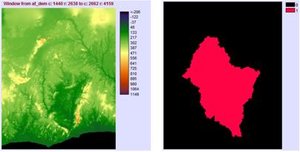
Practically, GIS software uses the above algorithm to determine watershed areas for each square area called a pixel, whereby the height of each pixel is given by a Digital Elevation Model such as Hydrosheds (see above). By cutting off pixels with a watershed area below a certain threshold, one obtains a drainage or river network. Similarly, one can quickly outline for any chosen pixel what the watershed area is.

Sample application: Left topomap for the Volta Basin and surroundings in West Africa (GTOPO30), right the Volta River Basin